1. Open your project in SiteCam.
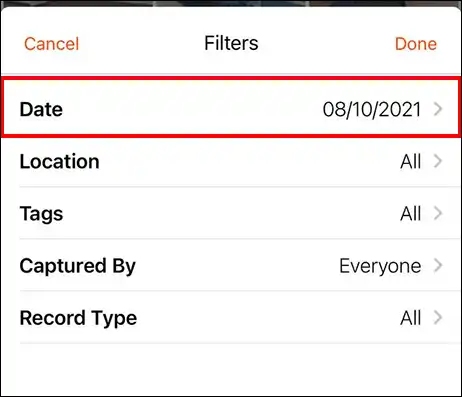
2. Use Filters to narrow down the photos to include in the report.
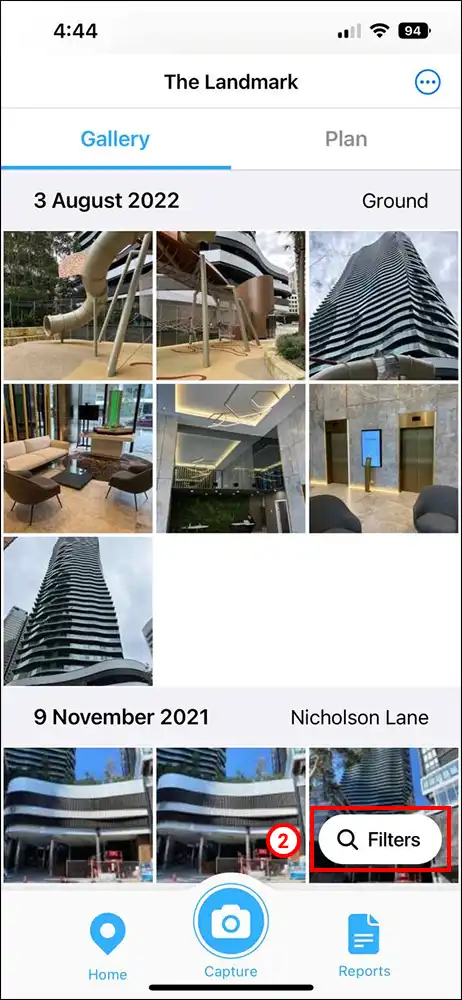
In this example we have filtered the view to only show photos captured on the 08/10/2021.
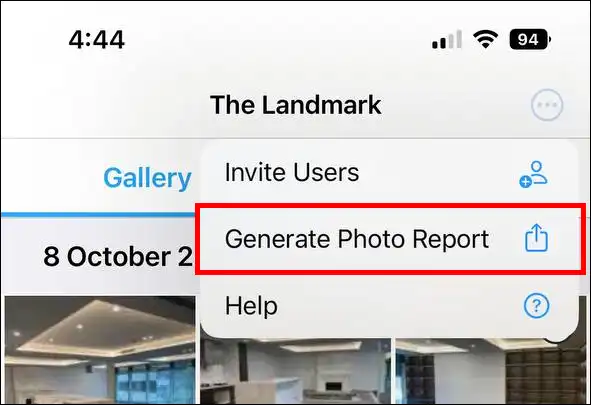
3. Tap on the 3 dot icon on the top right of the screen.
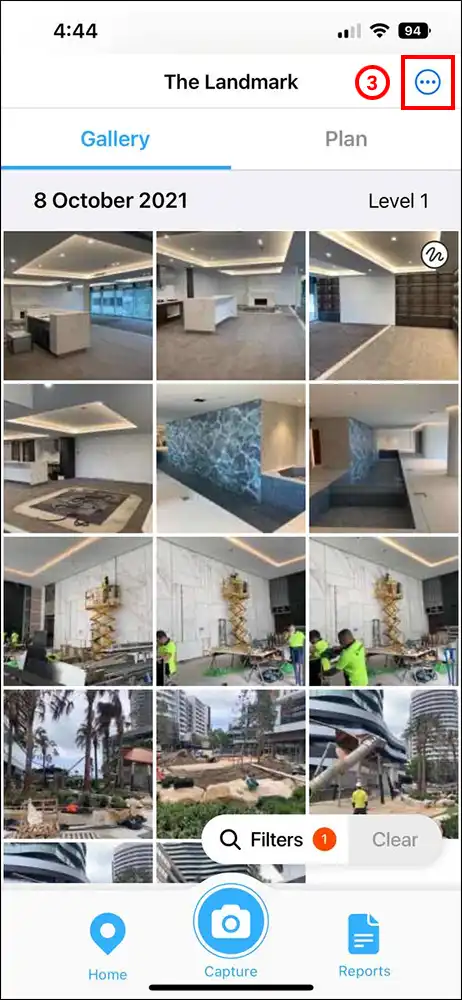
4. Select the Generate Photo Report button.
5. The generated report should appear in a couple of seconds.
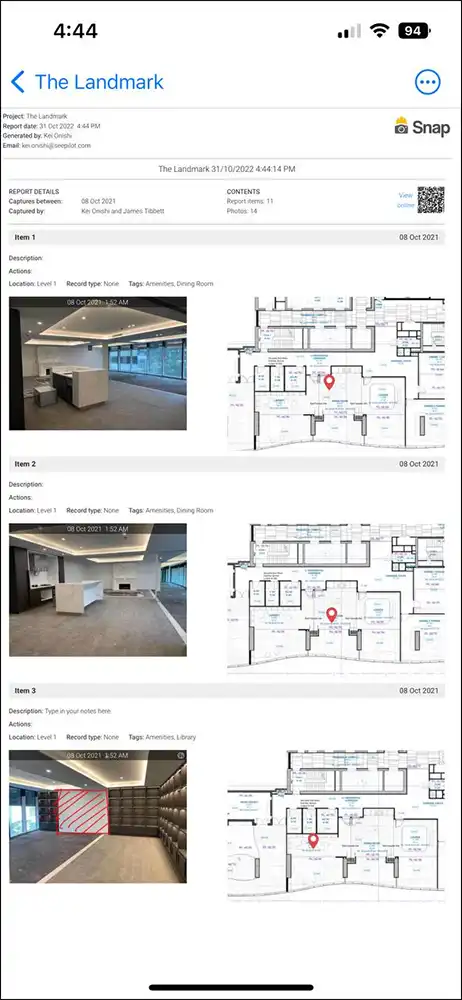
Report Items
A report you generate will be structured into sections called Items. These Items are based on the capture groups of photos that you load into SiteCam, i.e. photos added together with a common description and set of tags. If multiple photos from a capture group are within the generated report then these photos will be included together in the same report Item, next to the plan/map representing the position of that capture group.
Sharing the report (URL)
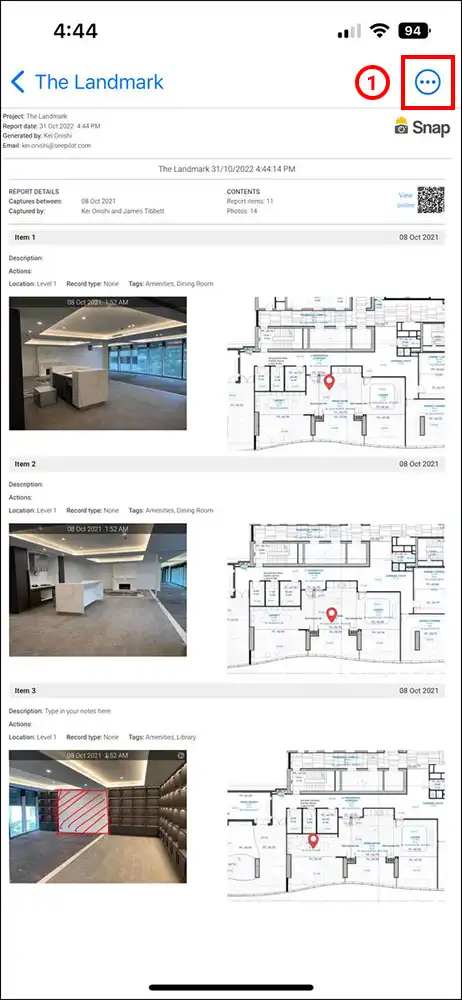
1. Tap on the 3 dot icon on the top right of the report screen.
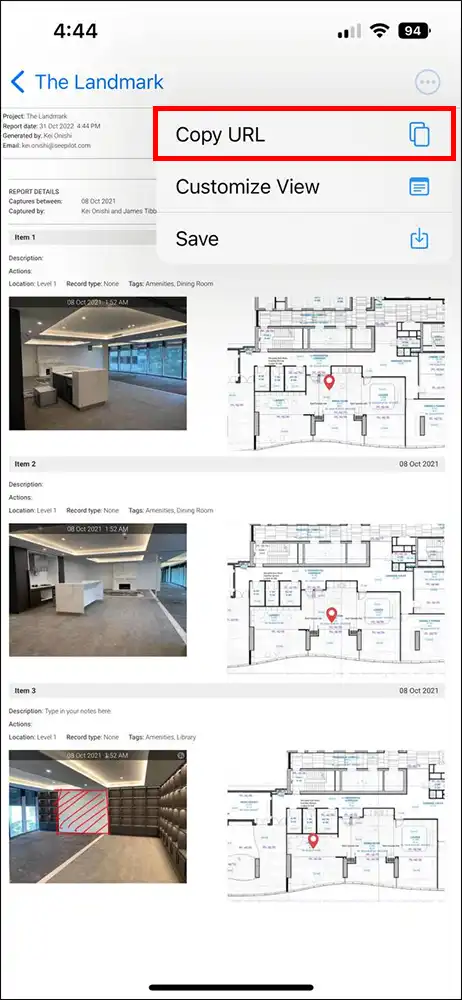
2. Select the Copy URL button.
Downloading the report (PDF)
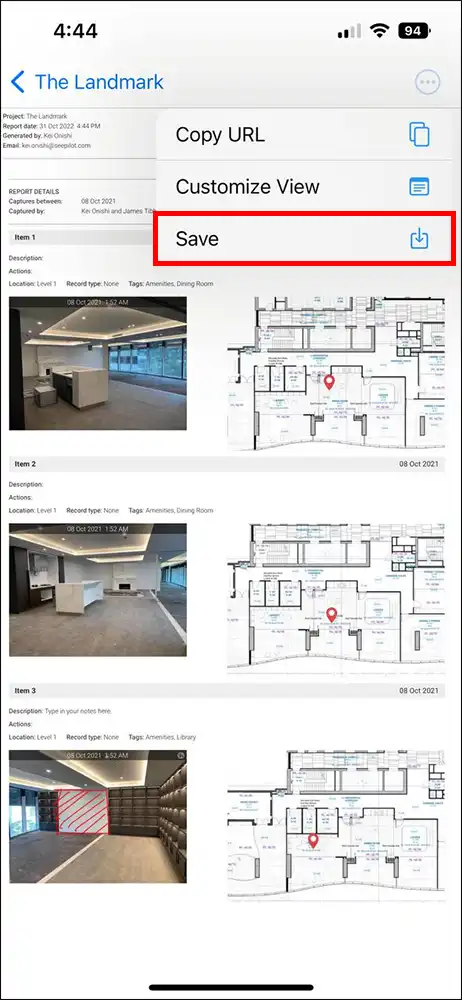
1. Tap on the 3 dot icon on the top right of the report screen.
2. Select the Save button.
On Android phones, the PDF report will get saved automatically to your device.
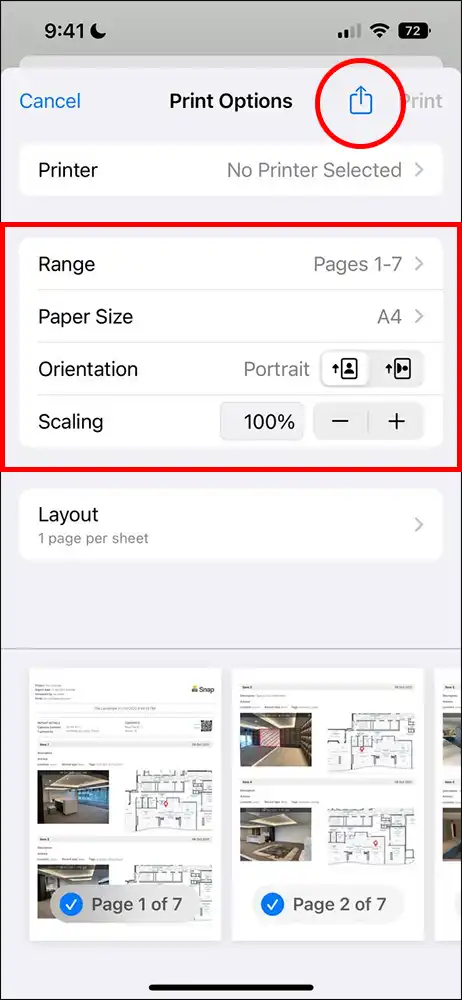
On iPhones, the Print Options panel will pop up. Leave the Printer selection empty and press the Share icon (top right) to save the PDF report on your device. You can also set the page range, size, and orientation below.
Customizing the report
You can customize the look of your report by adjusting various settings in the Customize View menu.
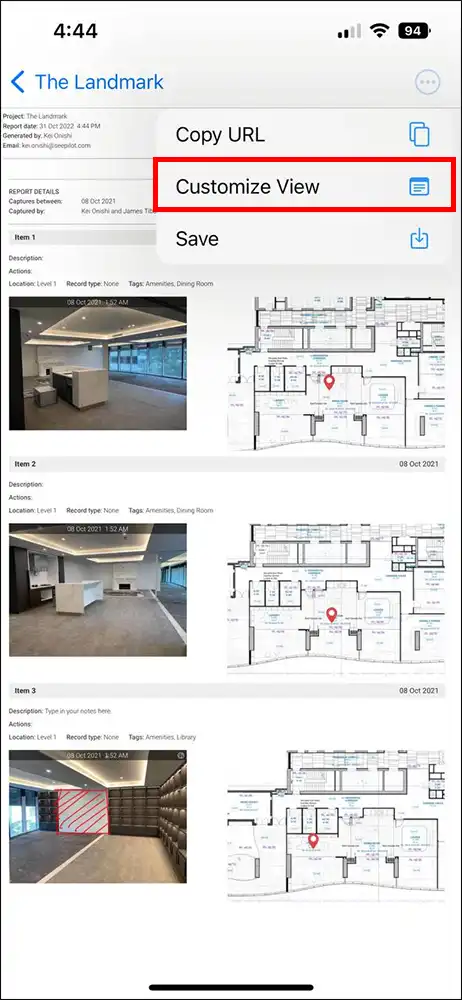
1. Tap on the 3 dot icon on the top right of the report screen.
2. Select the Customize View button.
Various settings for the report are available:
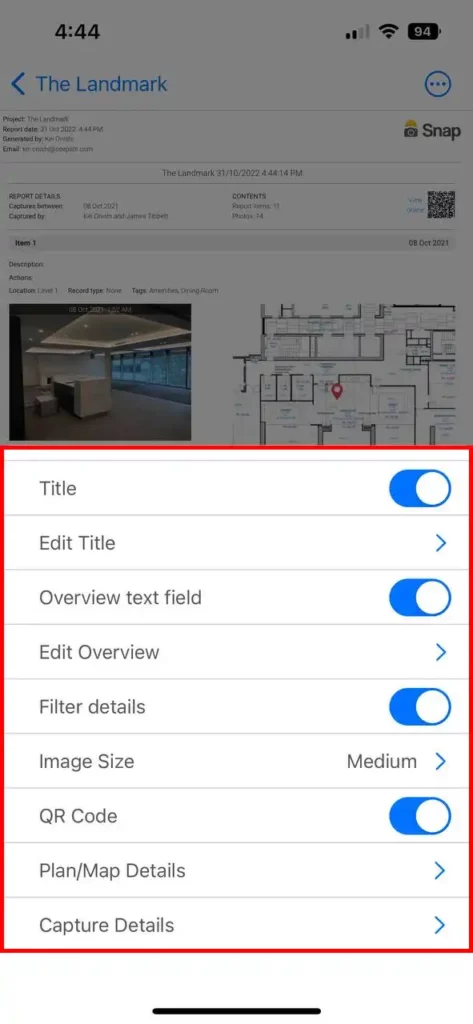
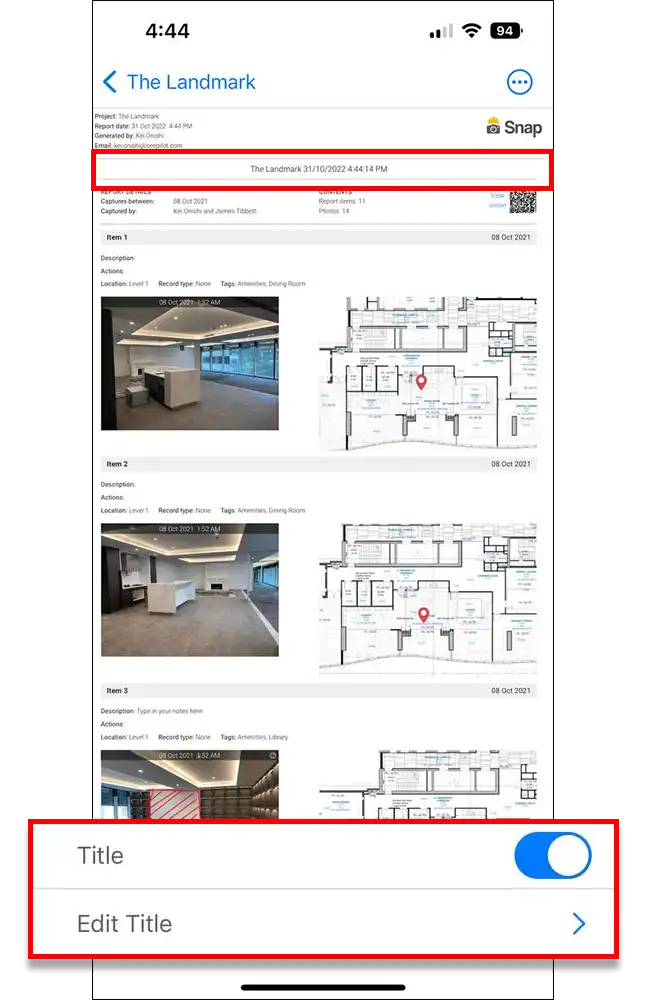
Title toggle
This will allow you to show/hide the report name at the top. Tap on Edit Title to edit the report name.
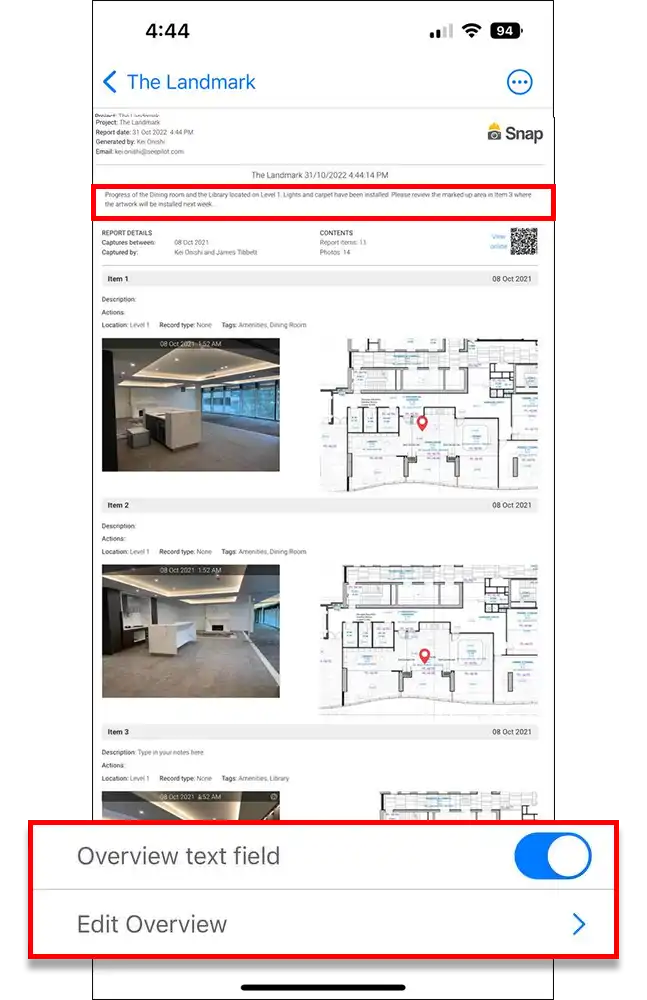
Overview toggle
The overview toggle will show/hide a text field under the report title where you can type a short summary of the report. Tap on Edit Overview to modify the summary text.
Filter Details / QR Code toggle
The Filter Details section contains some information about the report such as when the photos were captured and who captured them. It also includes a QR code and a link that the recipient can use to view the report online.
Use the QR Code toggle to show/hide the QR code on the report.
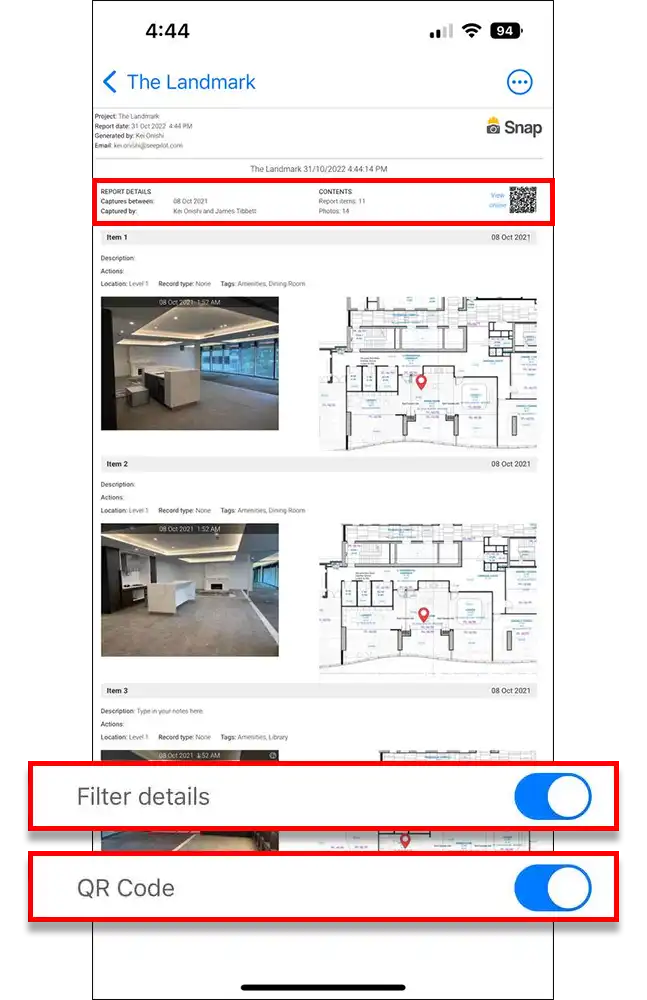
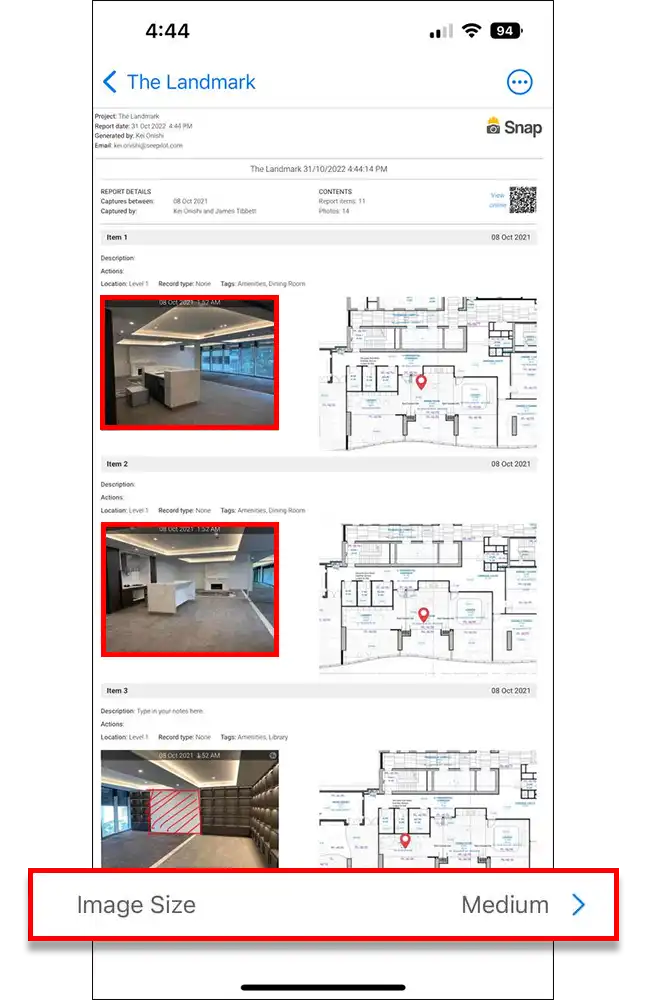
Image Size
Image Size will set the size of all the photos in your report. There are 3 different photo sizes you can choose from (Small, Medium or Large). By default it is set to Medium size.
Plan/Map Details
If your report contains plans or maps, this section will allow you to adjust various settings such as size and zoom level.
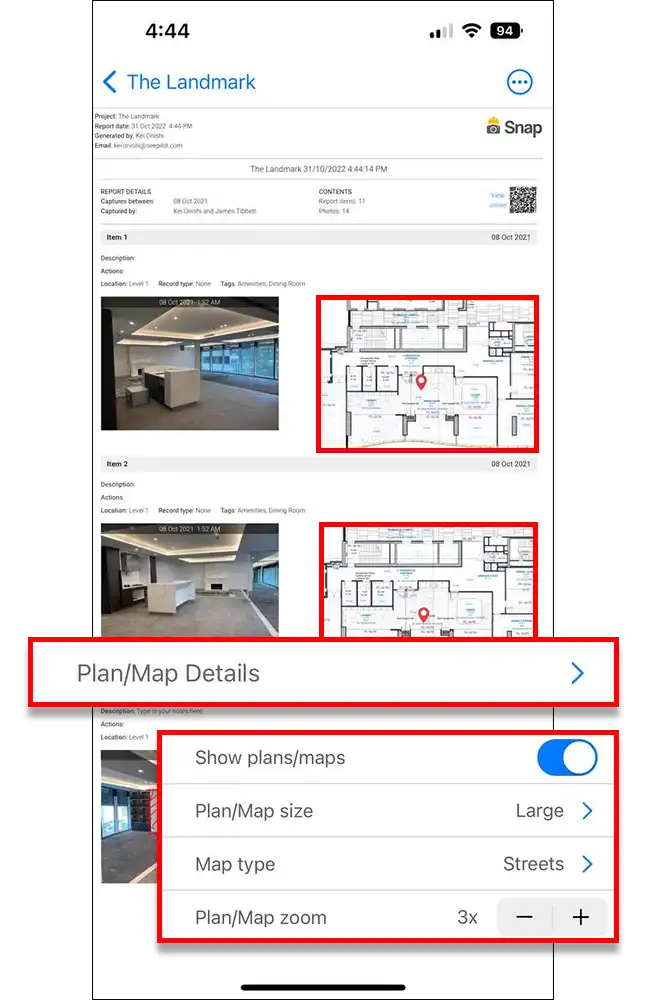
- Show plans/maps – When enabled, will display a plan/map next to each capture item
- Plan/Map size – Choose from Small, Medium, or Large plan/map size. By default, it is set to Medium size.
- Map type – Select between Streets or Satelite map types (only applies to maps in the report).
- Plan/Map zoom – This will adjust the zoom level of any plans/maps in the report.
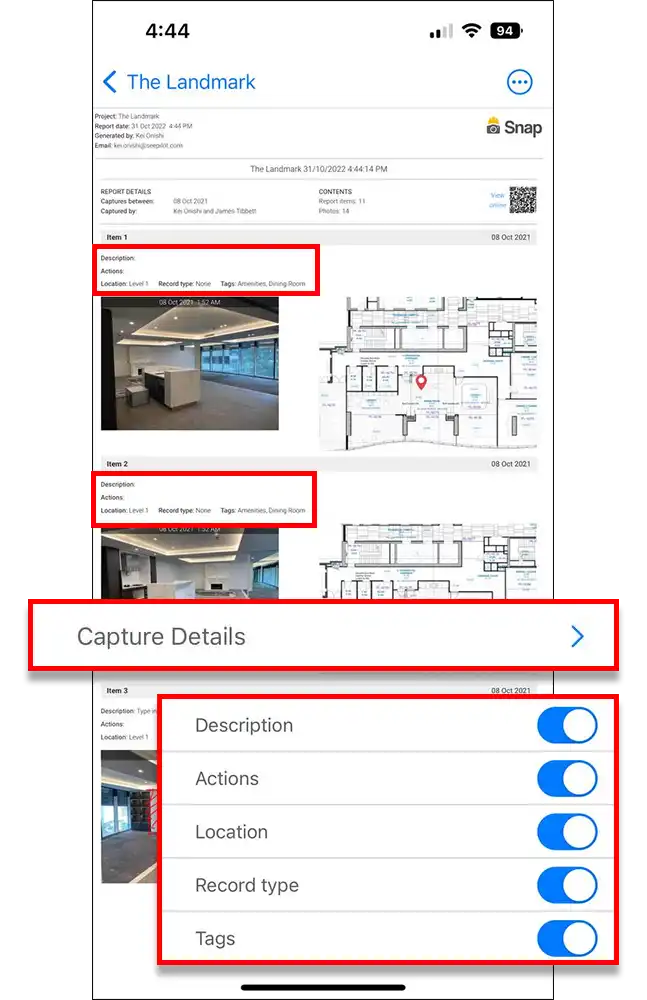
Capture Details toggle
In this section, you will be able to specify whether to show or hide various capture details in each item of the report.