Web (Browser)
How to Create a Report
1. Login to the SiteCam Web App and open your project.
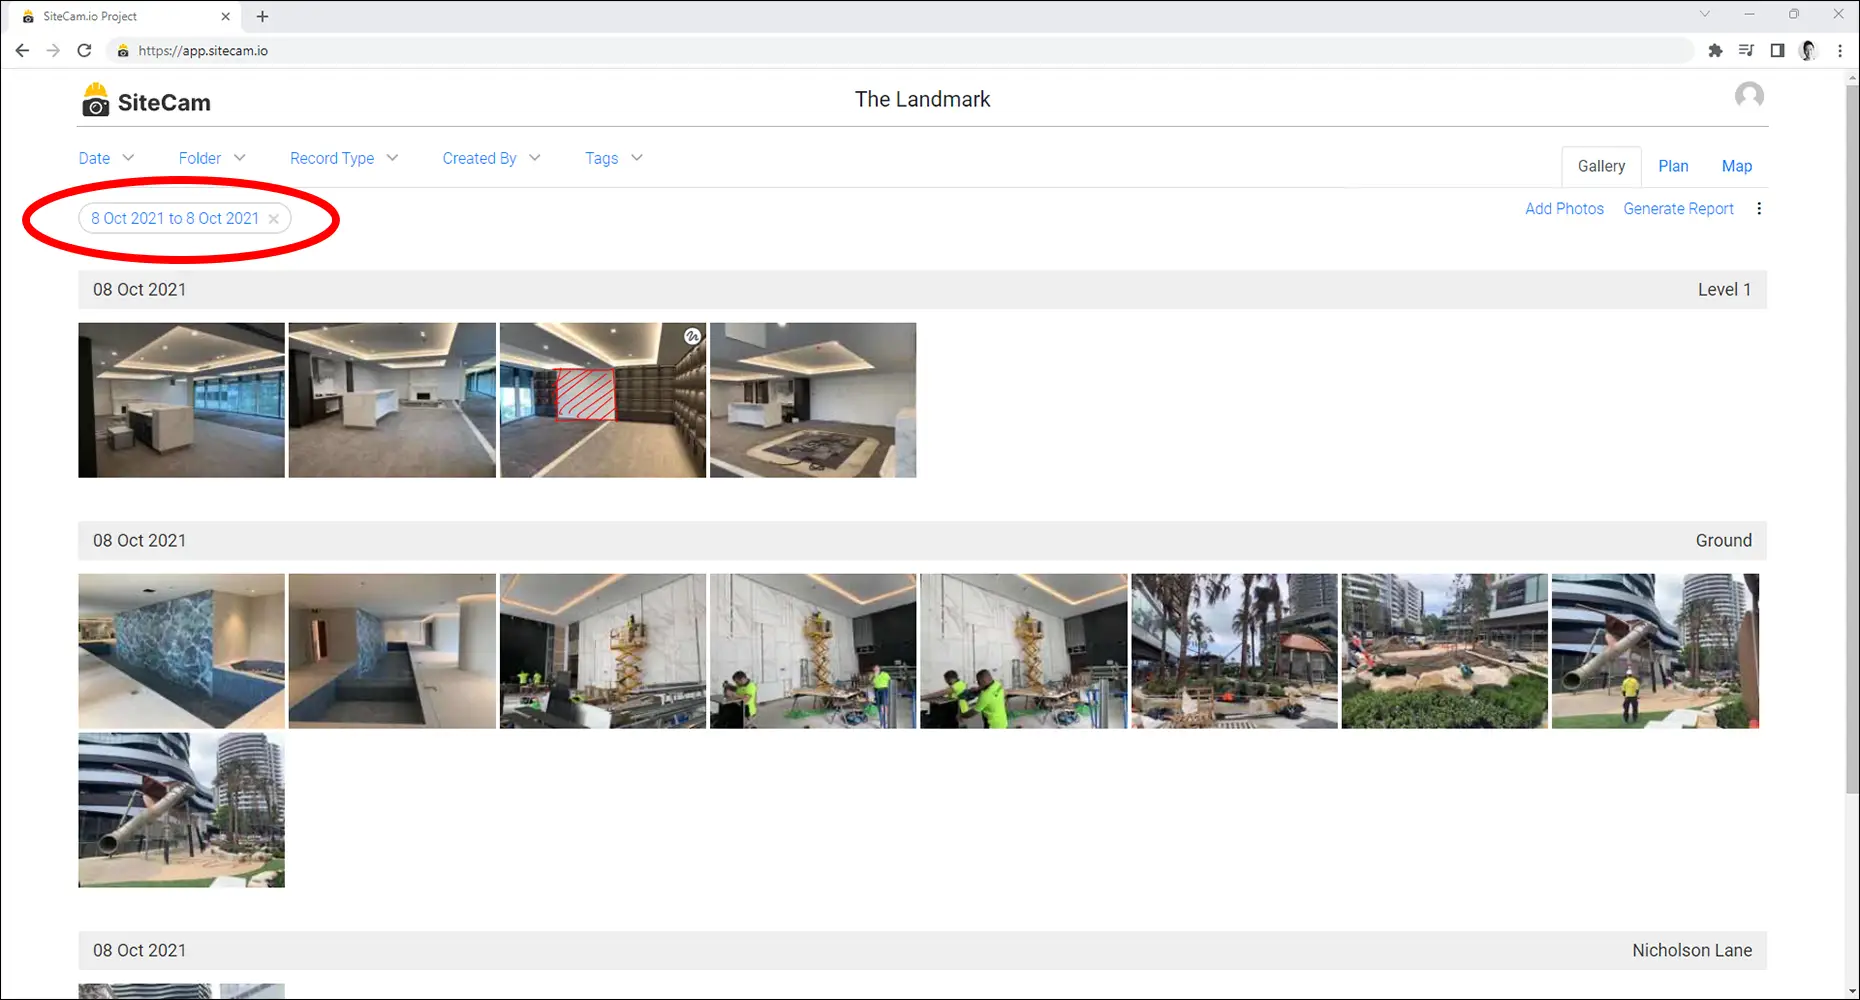
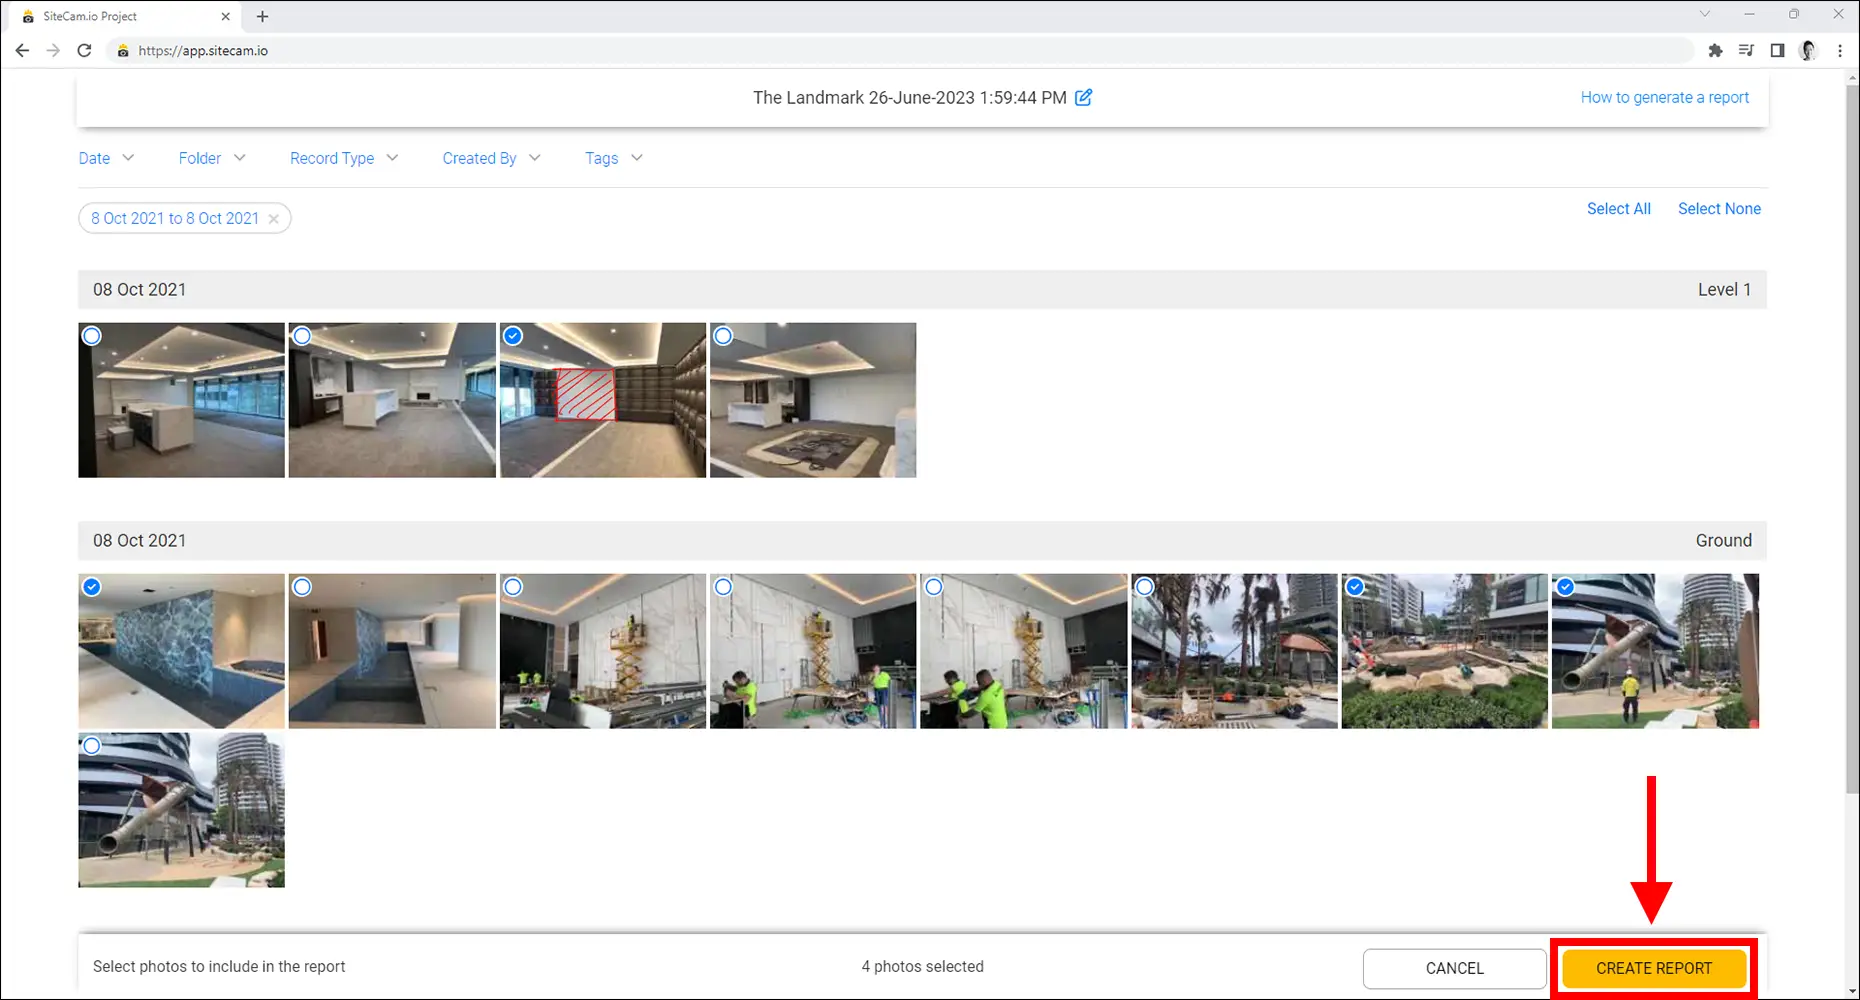
2. If you have lots of photos in your project, it is recommended to first apply some filters to narrow down the photos to include in the report.
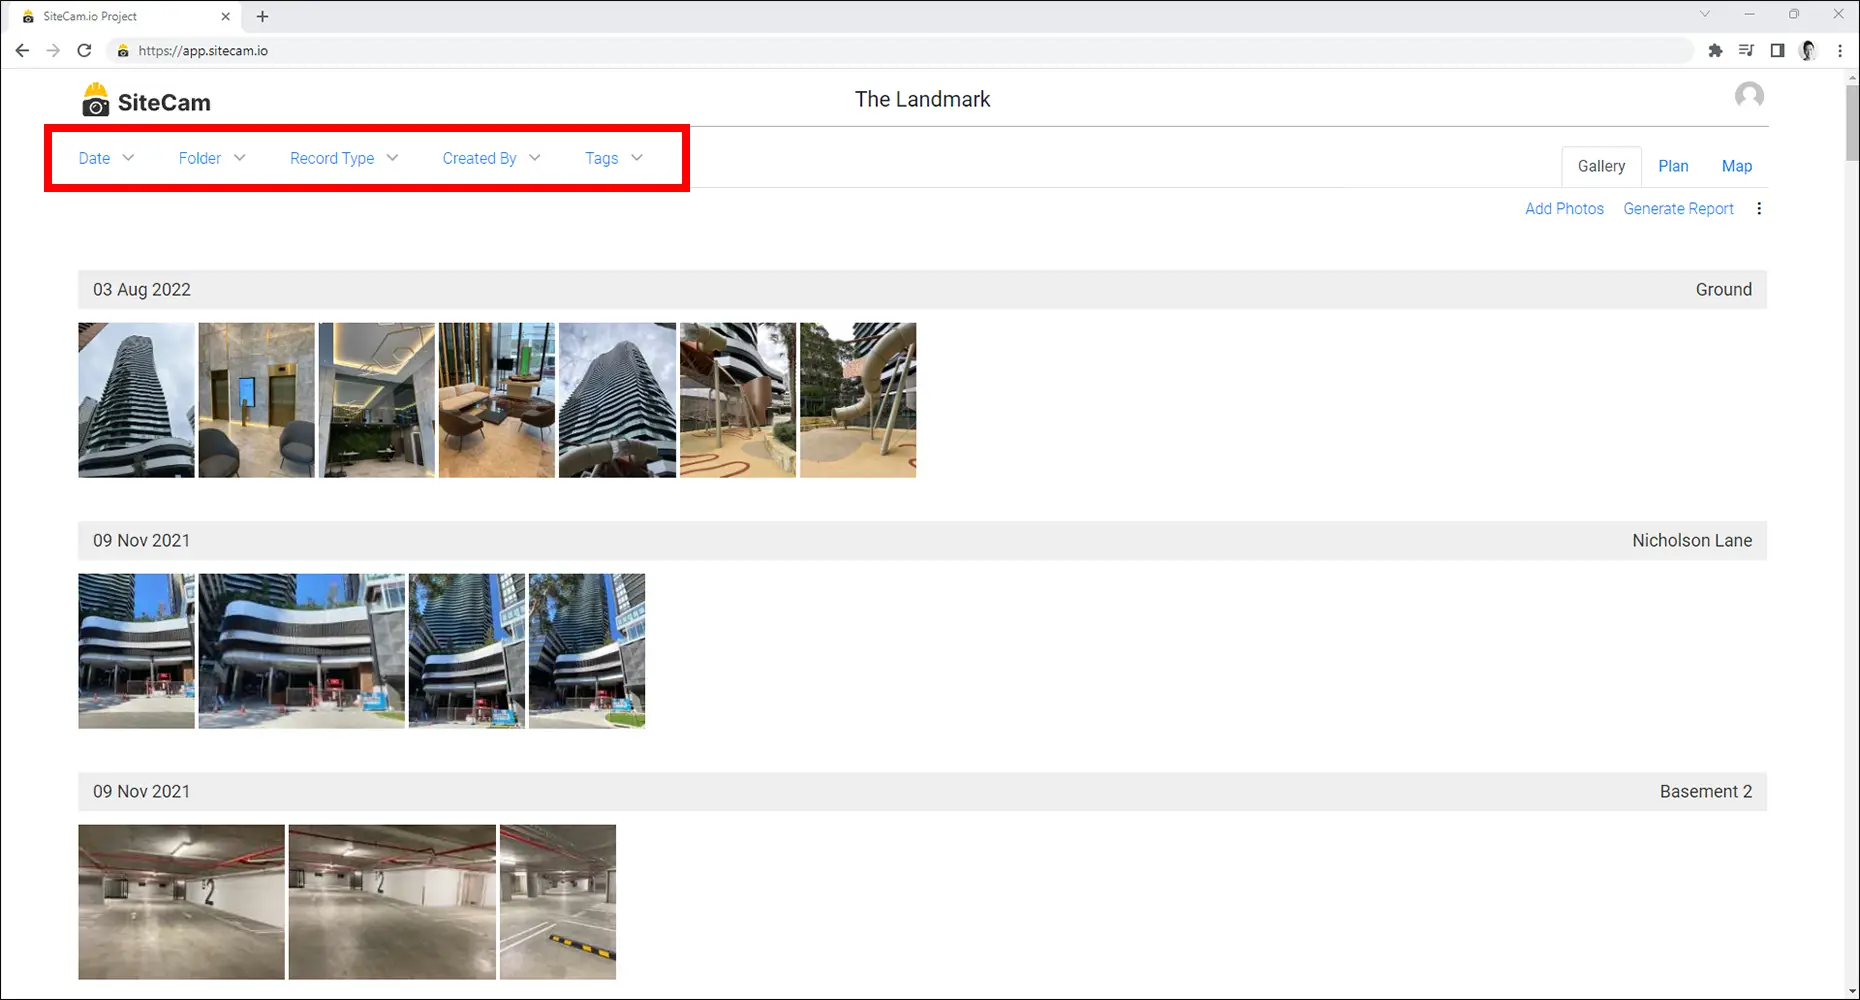
In this example we have filtered the project to only show photos captured on the 9th November 2021. Click the Select Photos button to enter the photo selection mode.

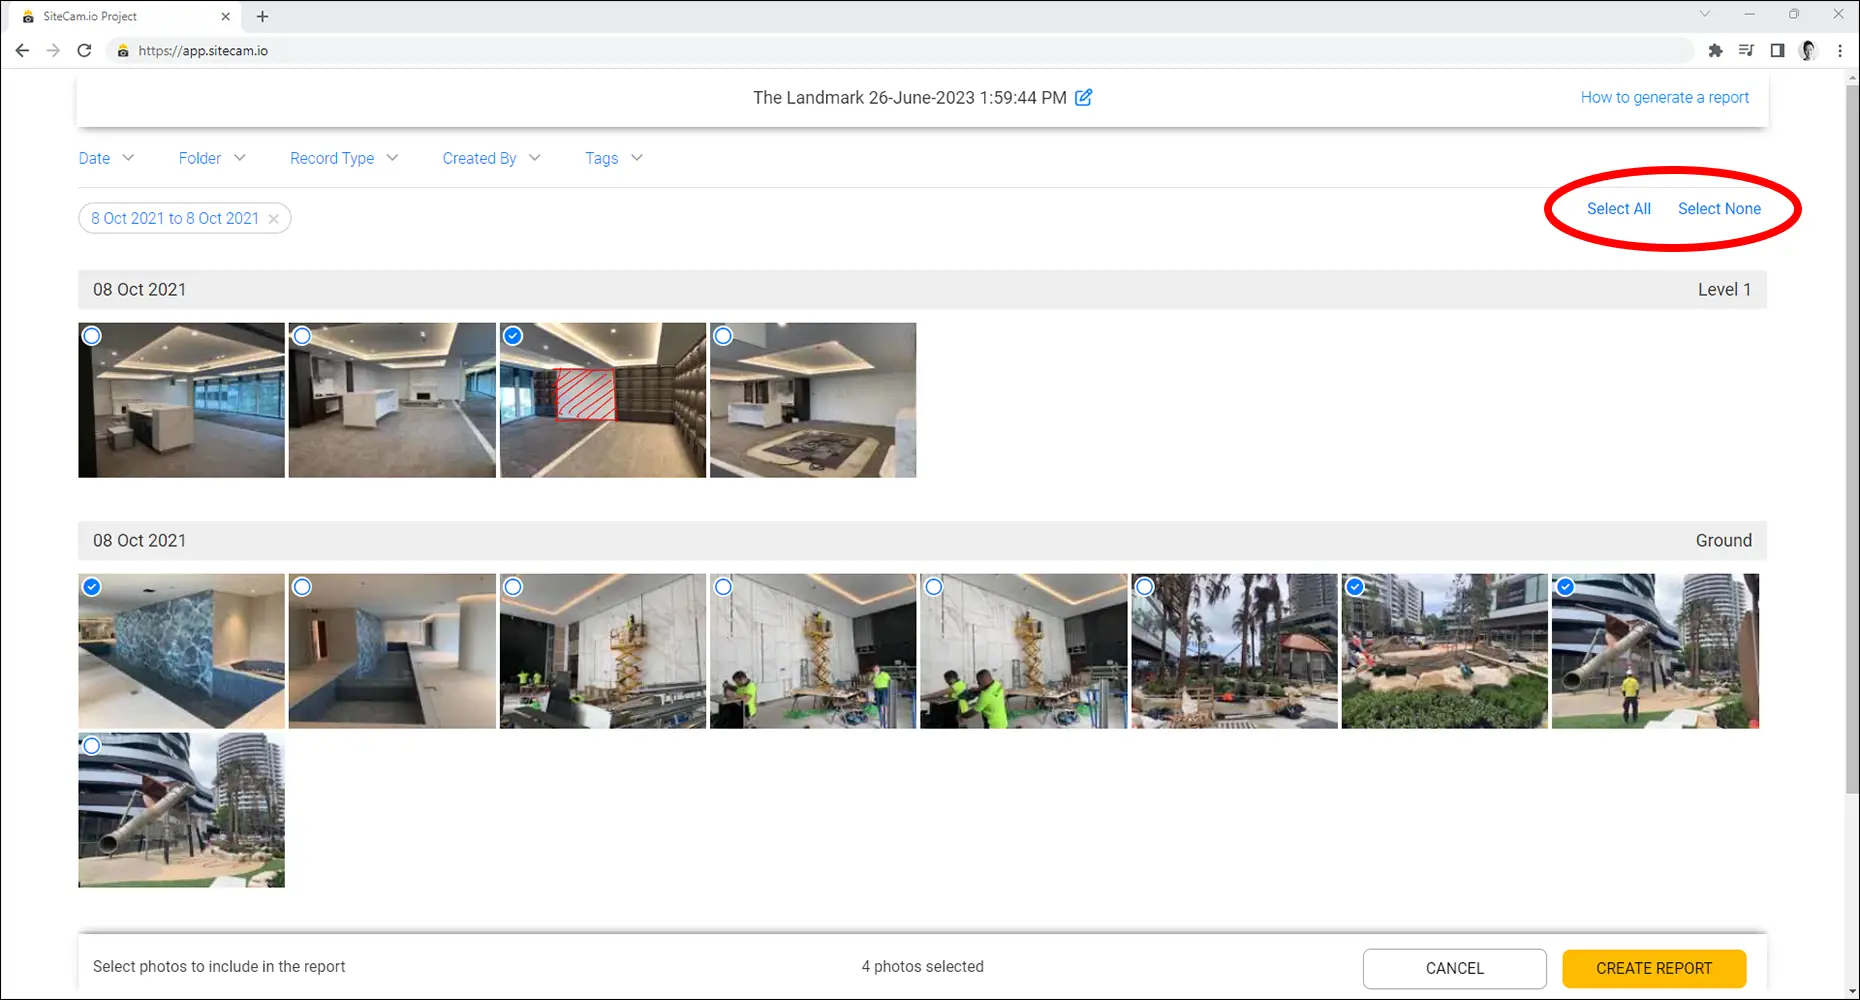
3. Select the photos that you want to include in the report by clicking on the thumbnails. You can quickly Select All or Select None by using the buttons on the right.

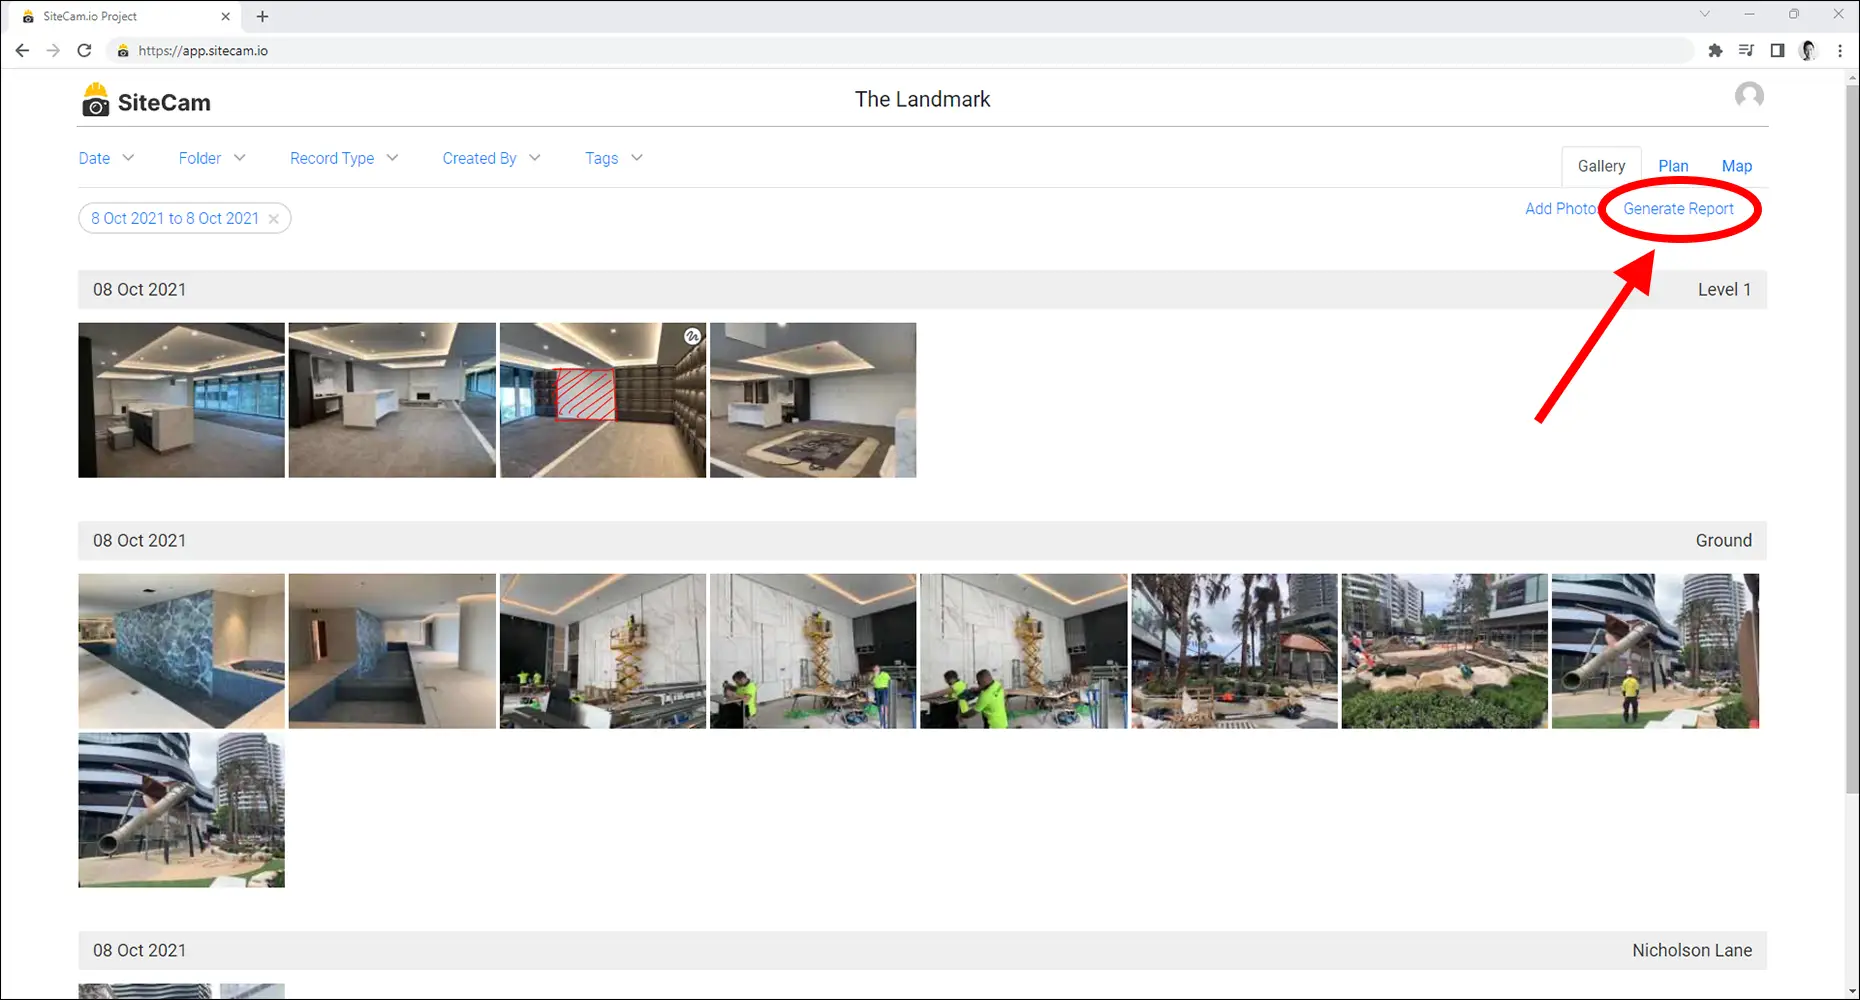
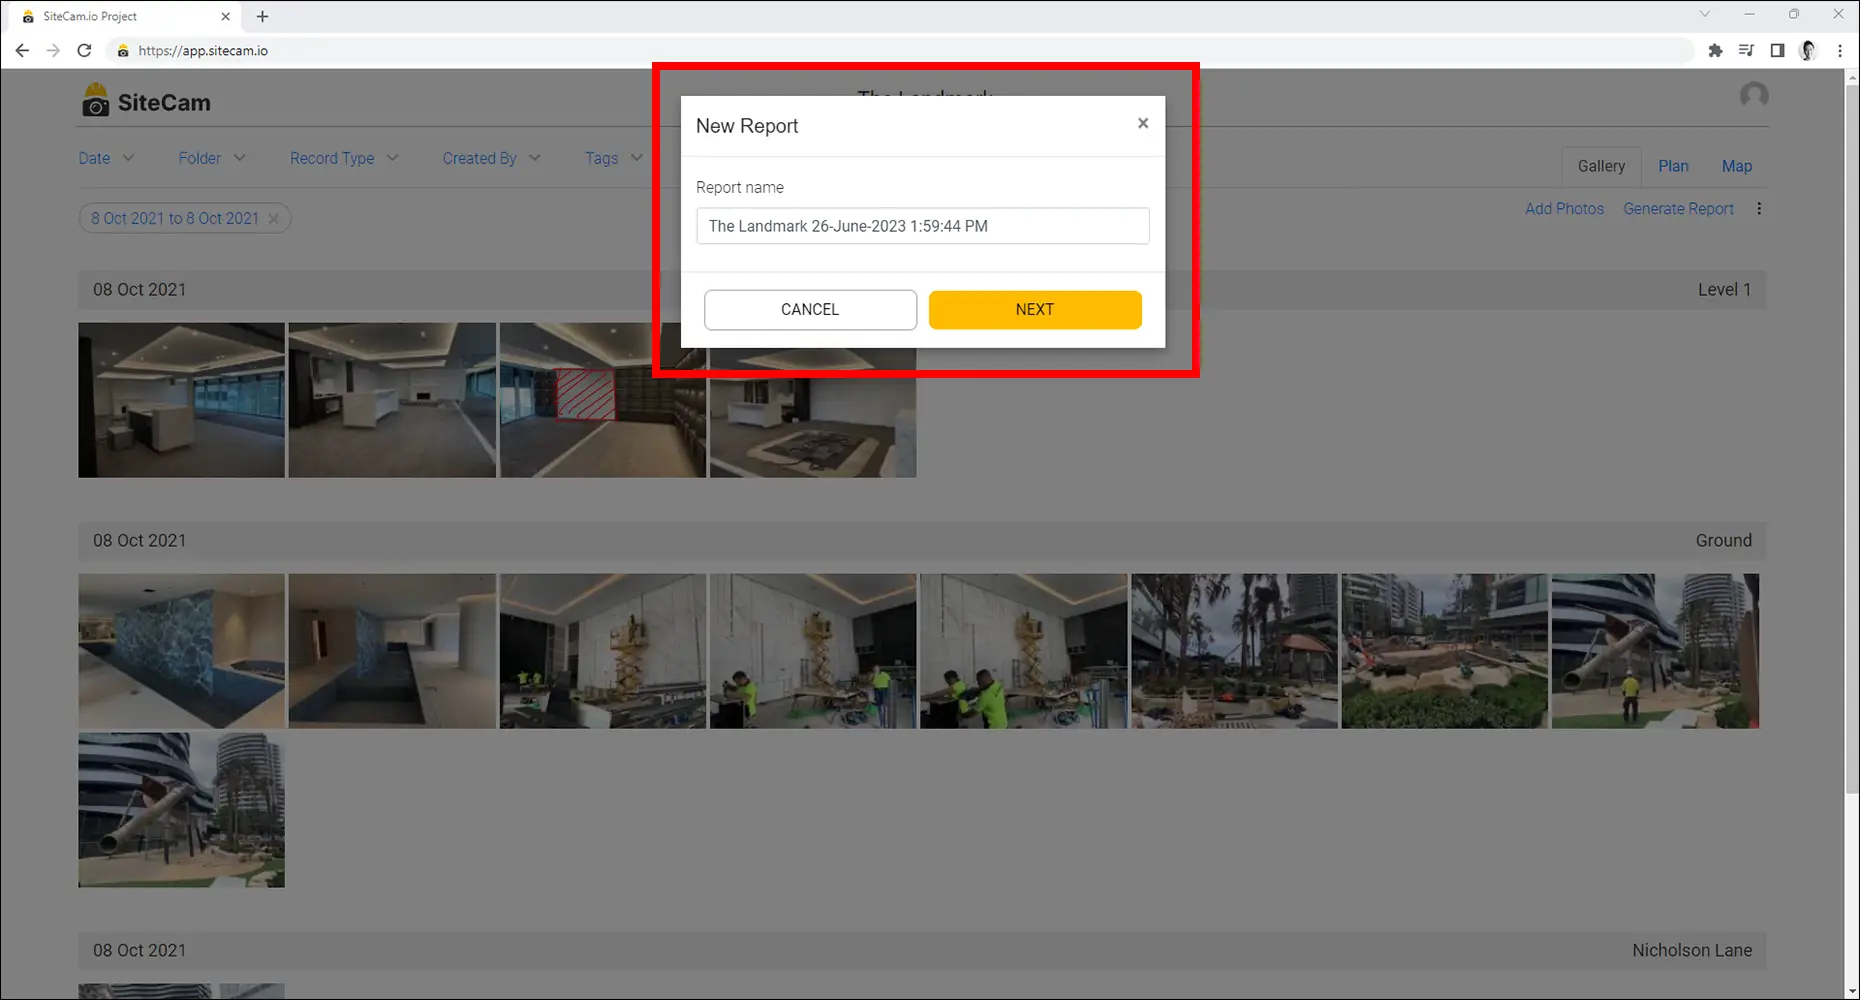
4. Finally, click the Generate Report button to create a report from the selected photos.

How to Share a Report (URL)
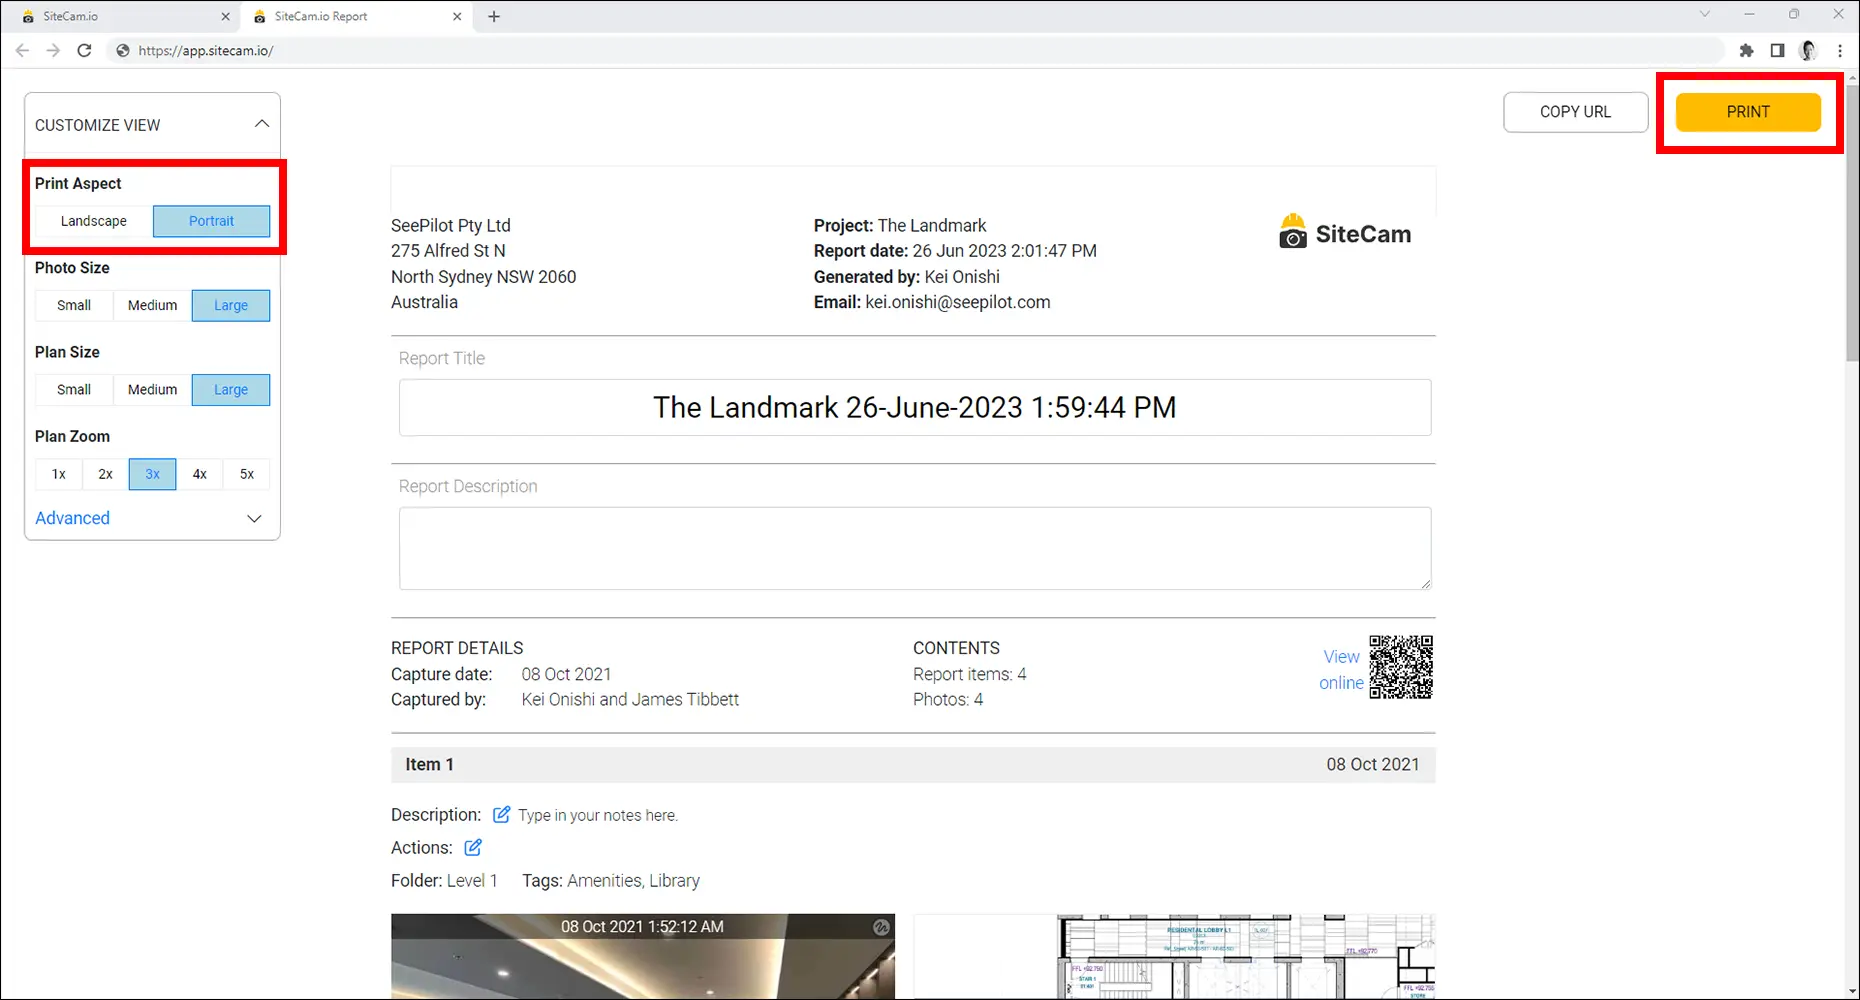
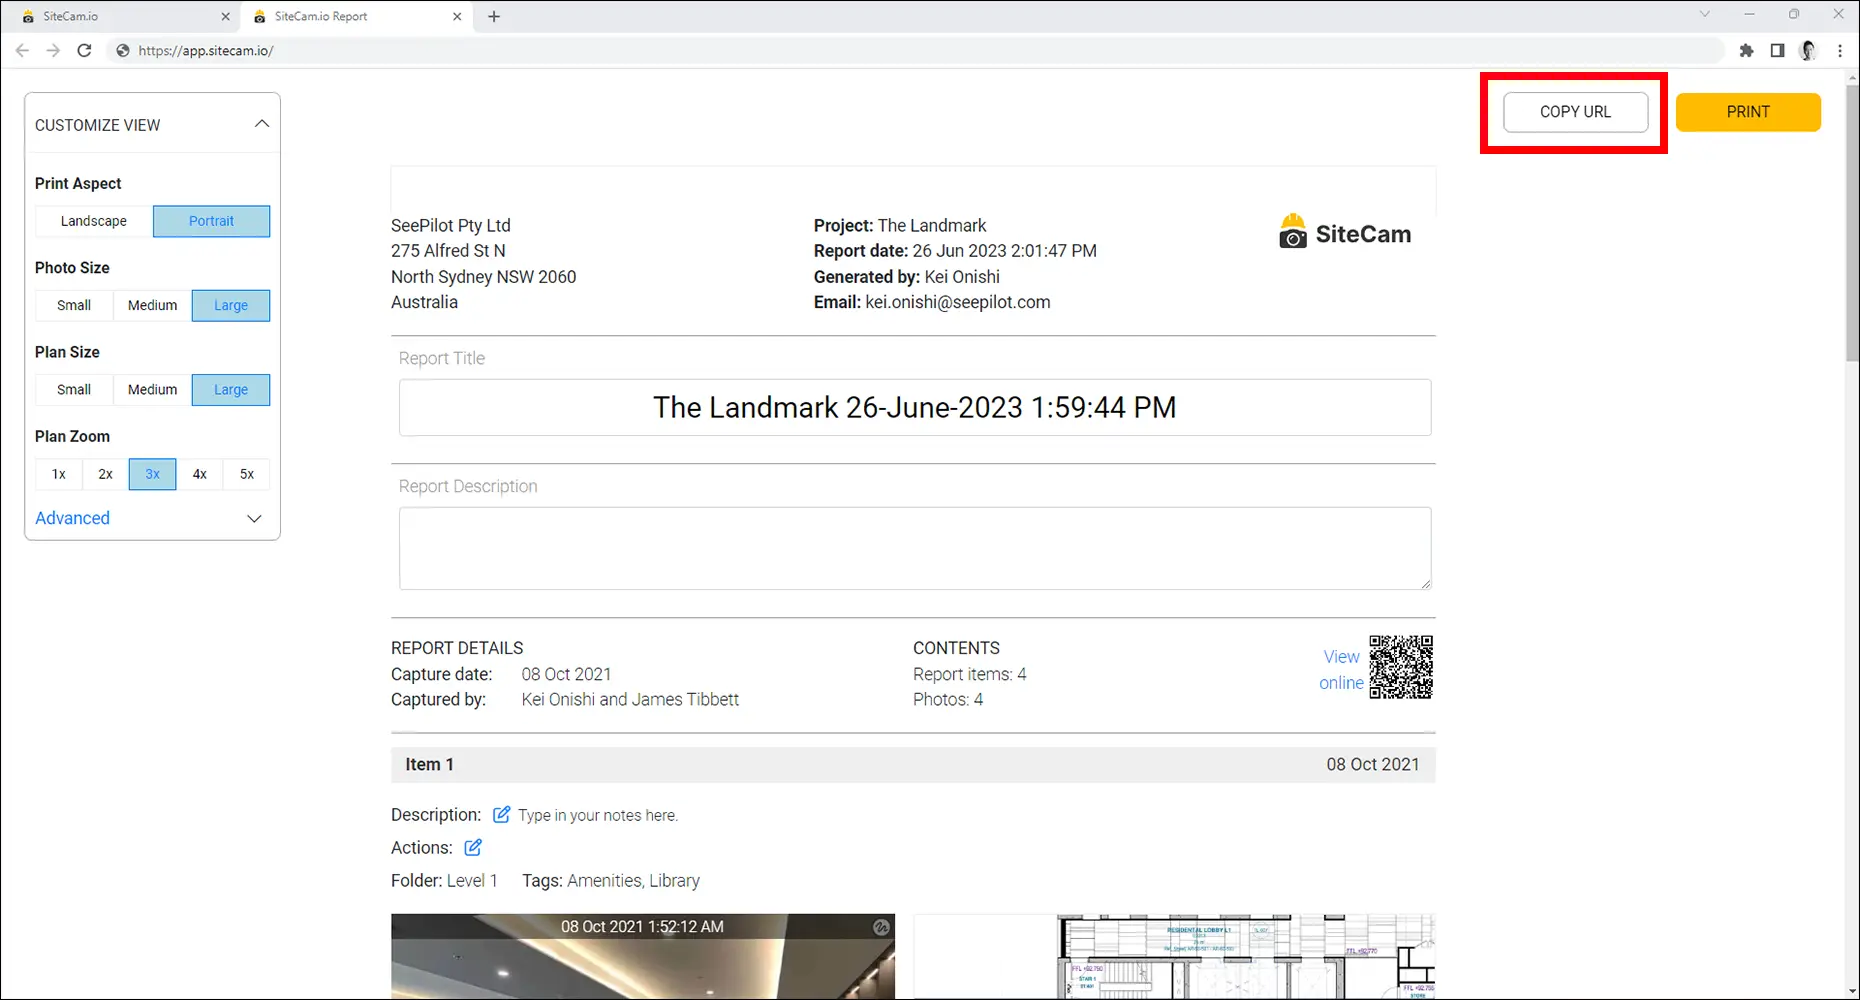
To get a link to the online report simply press the COPY URL button.
How to Download a Report (PDF)
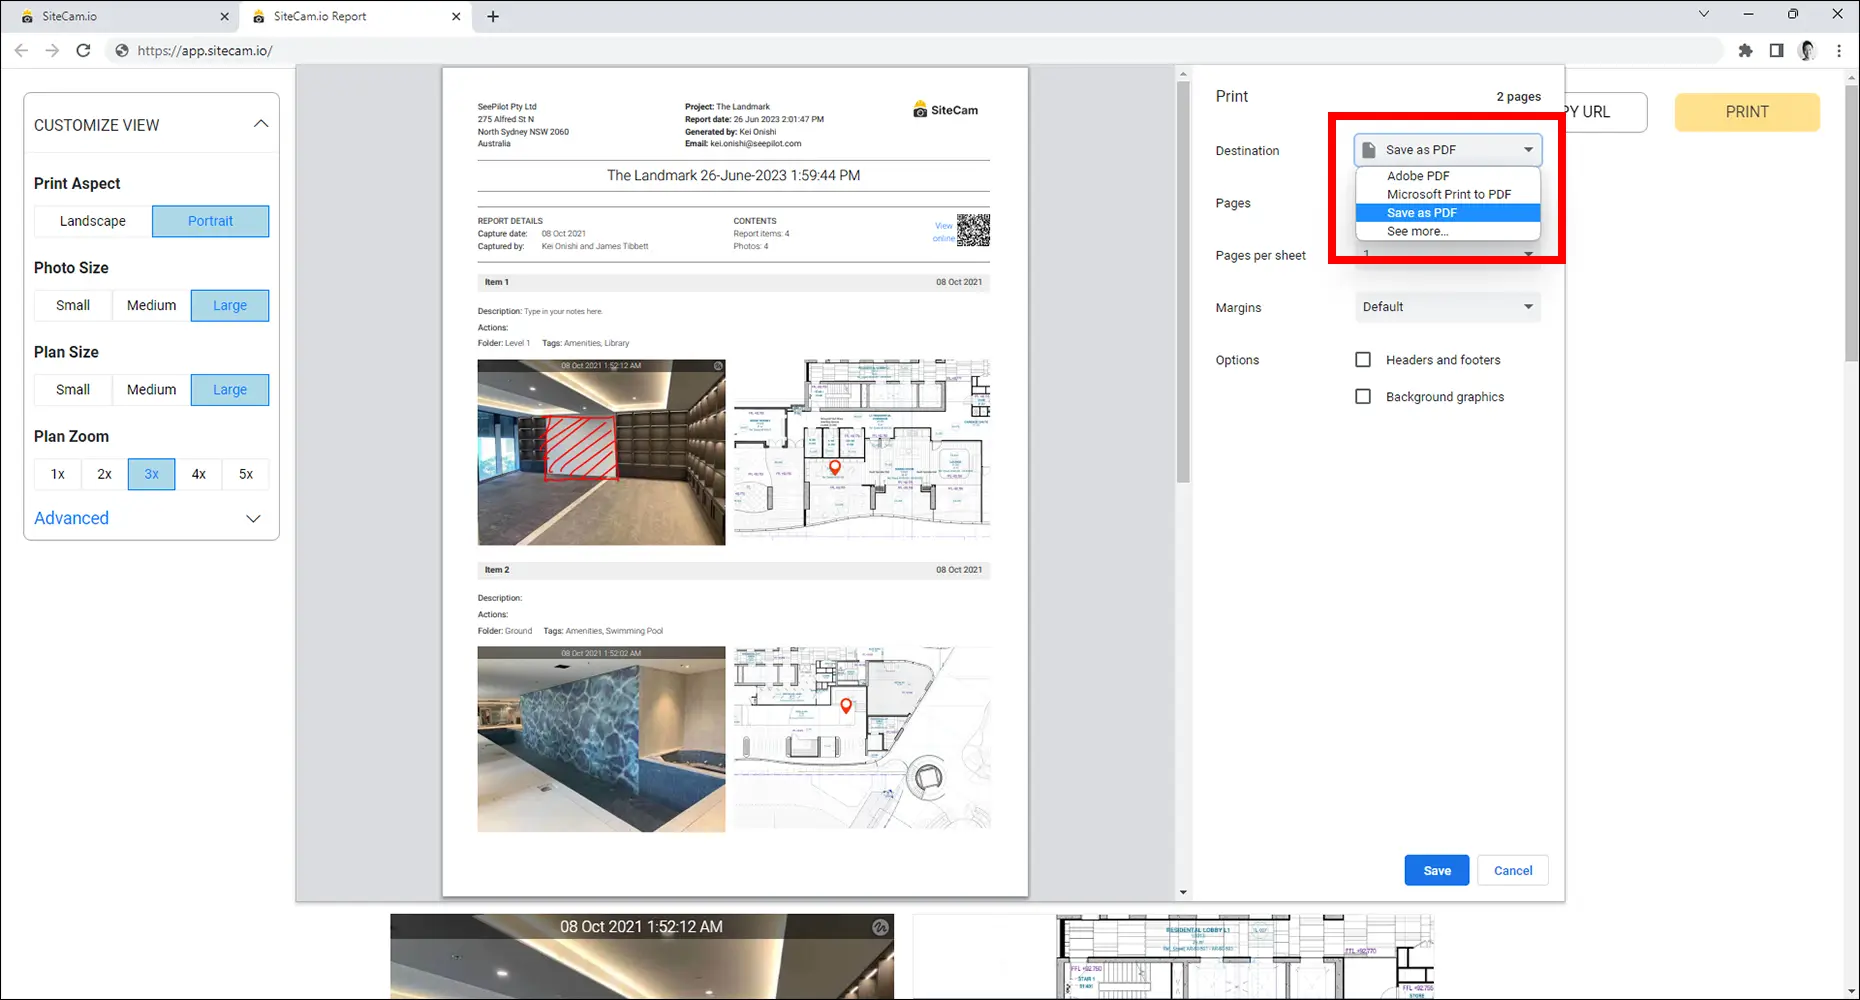
To download the report as a PDF first check that the Print Layout is set to your preferred orientation, then click the PRINT PDF button.

This will open your system’s default print dialog where you can select one of the PDF saving options.
Customizing the Report
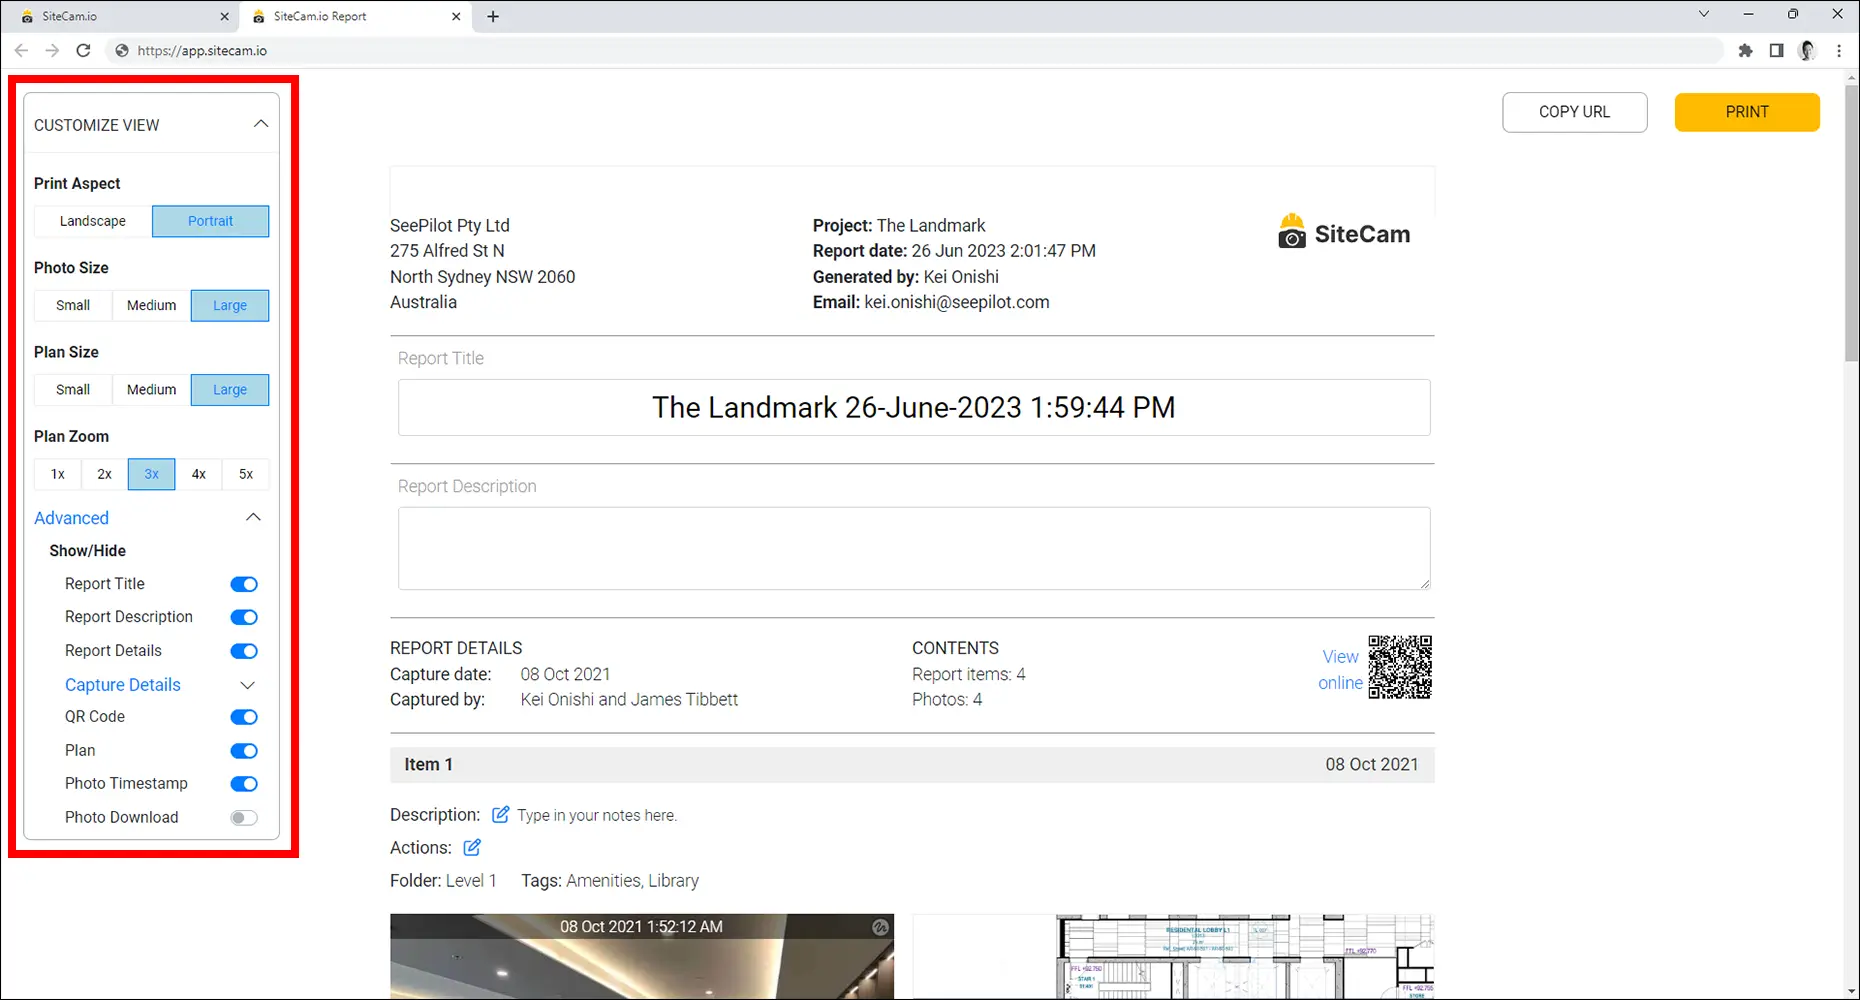
You can customize the look of your report by adjusting the settings in the customization panel on the left.

General Settings
The General Settings allow you to toggle on/off the following components of the report:
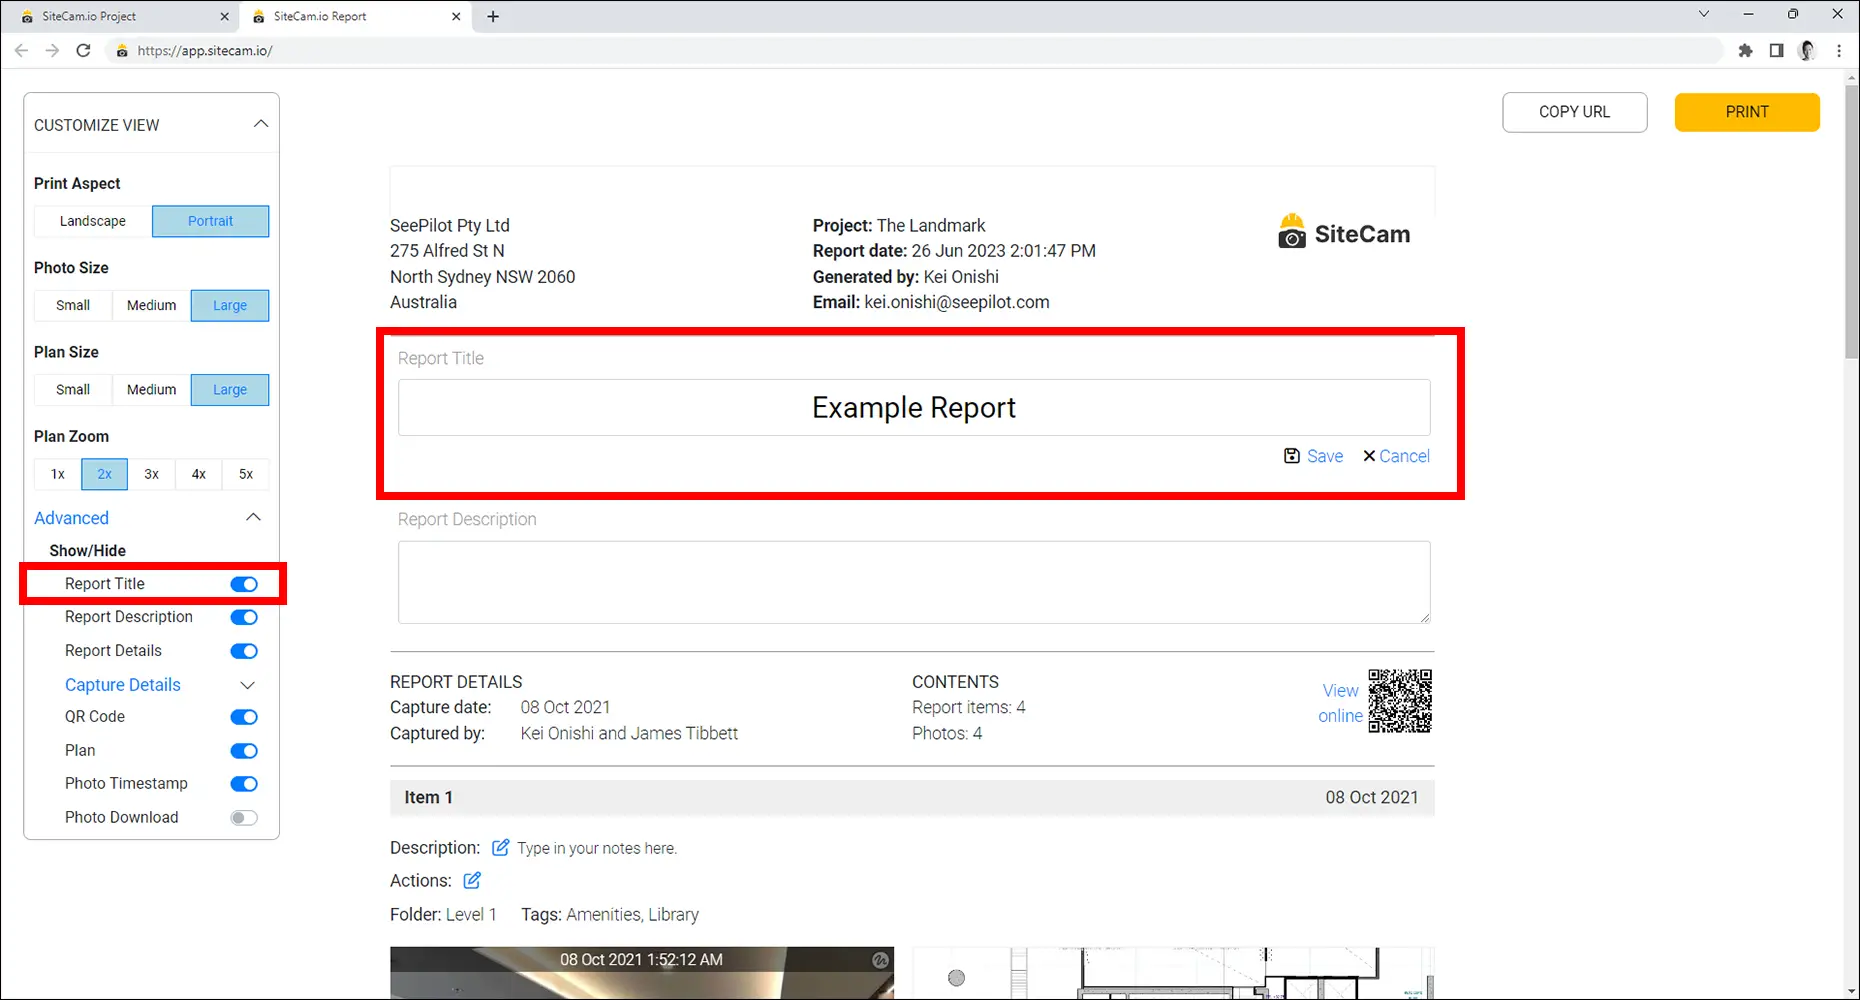
- Report Title – Edit the report title by clicking on the pencil icon.
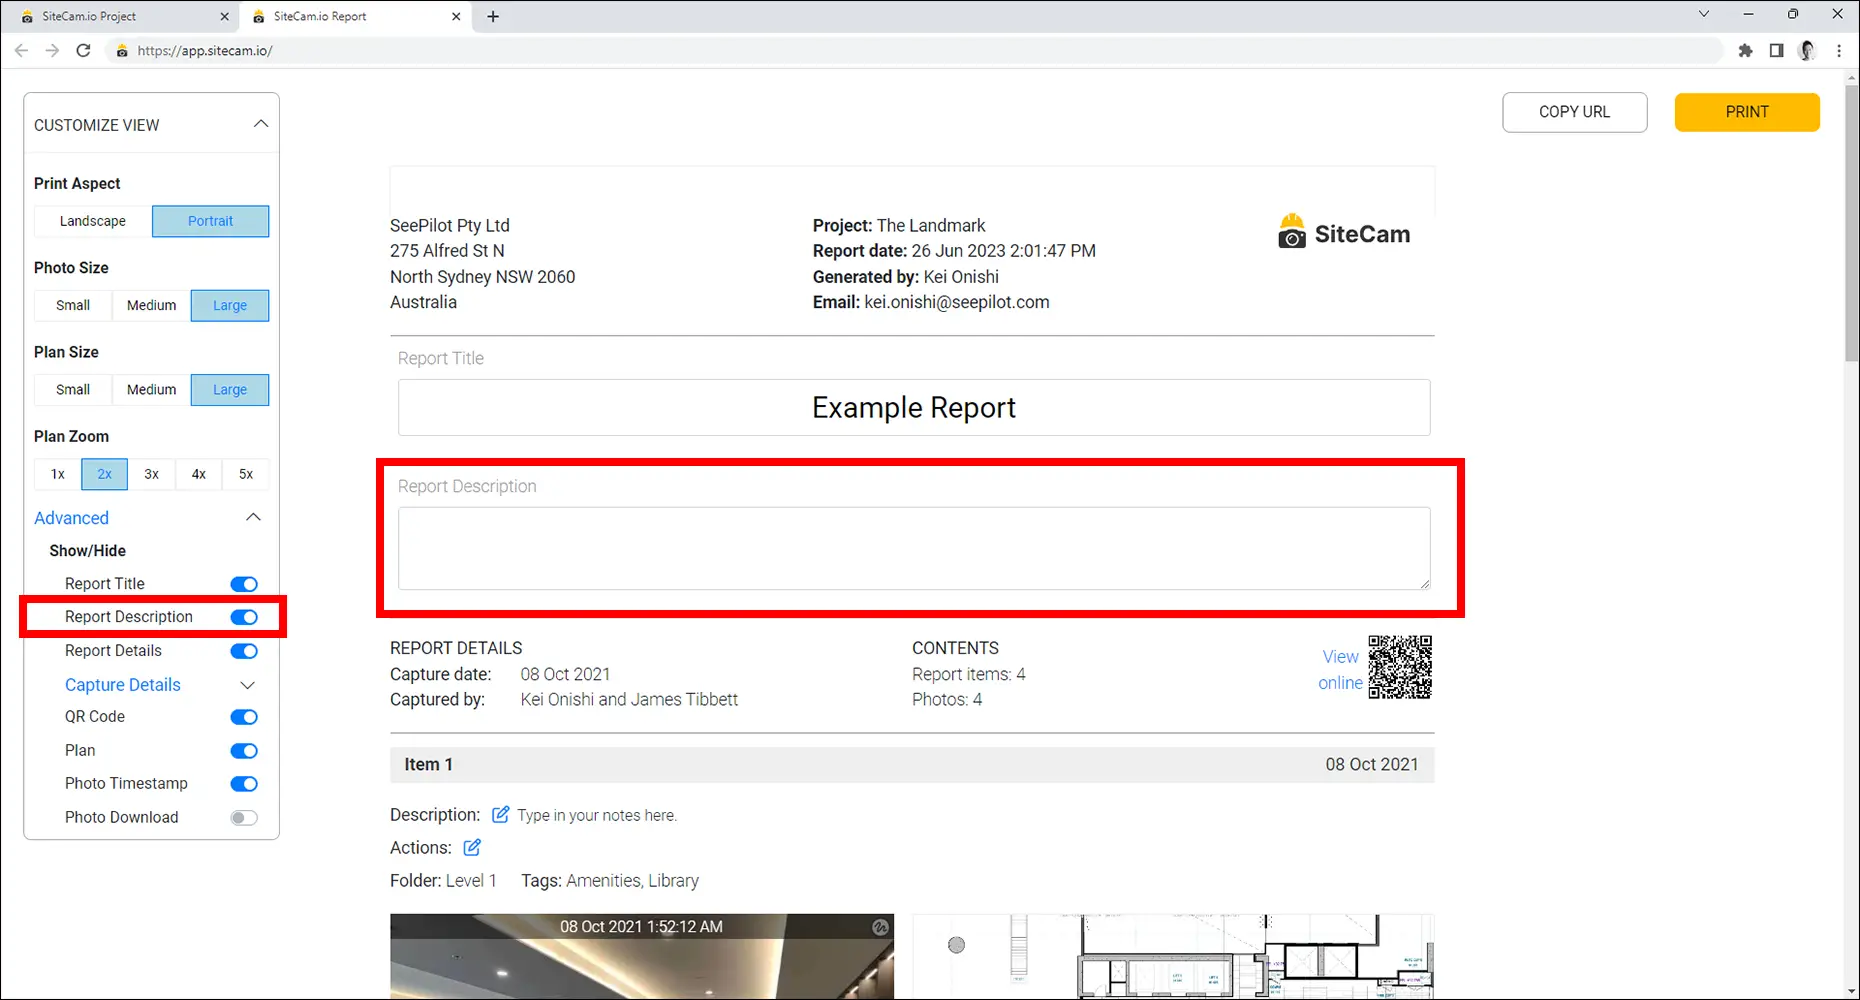
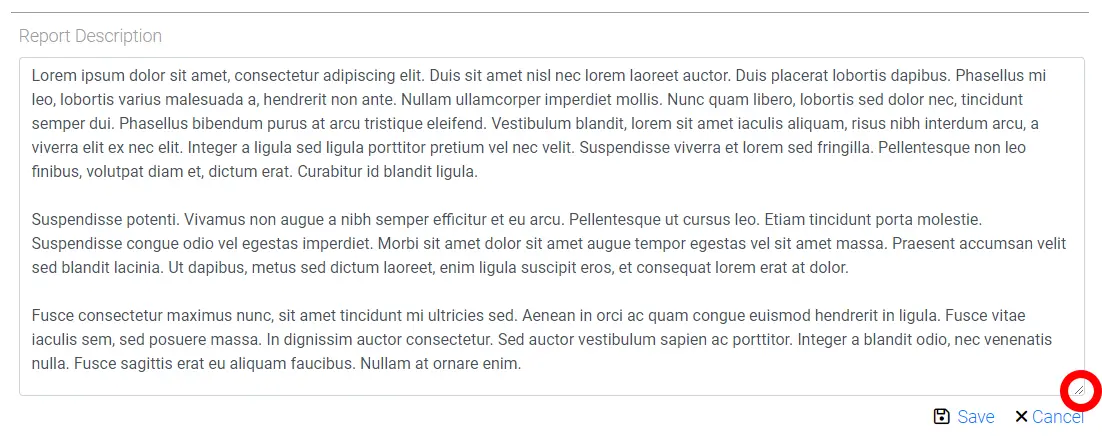
- Report Description – Click on the + Add Report Description button to add a description. Once a description is entered, click on the pencil icon to edit.
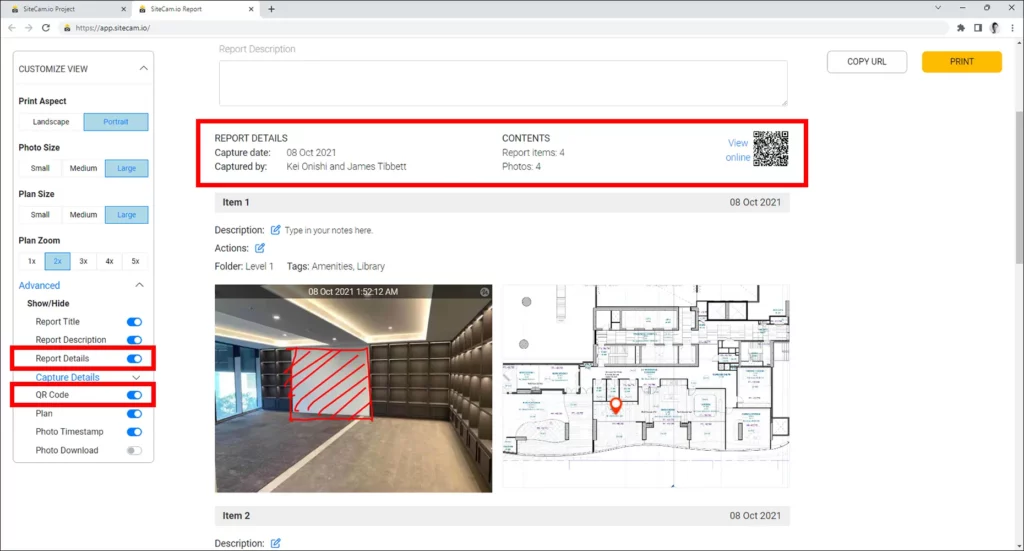
- Report Details – Additional information about the report, i.e. Date, captured by, number of items/photos & QR code.
- Text Blocks – You have the option to include additional text for each capture item by clicking the + Add Text Block button. Once the text has been added, click on the pencil icon to edit.
- QR Code – This allows the online report to be easily accessible through scanning the QR Code.
- Photo/Video Download – This allows people with access to the report’s URL download the photos/videos in the report.
- CSV Download – This allows people with access to the report’s URL to download the report in CSV format.
- Company Name & Address – Click here to learn more about how to add company name & address.
- Made with SiteCam – This option allows SiteCam Pro users to hide the “Made with SiteCam” footer at the end of their report.

Photos Settings
The Photos Settings allow you to customize the following photos components of your report:
- Size – There are three different photo sizes to choose from (Small, Medium or Large).
- Photo Timestamp – Show/hide photo date & time.
- Photo GPS – Show/hide photo GPS coordinate.
- Photo Markup – Show/hide markup (if available).

Plan Settings
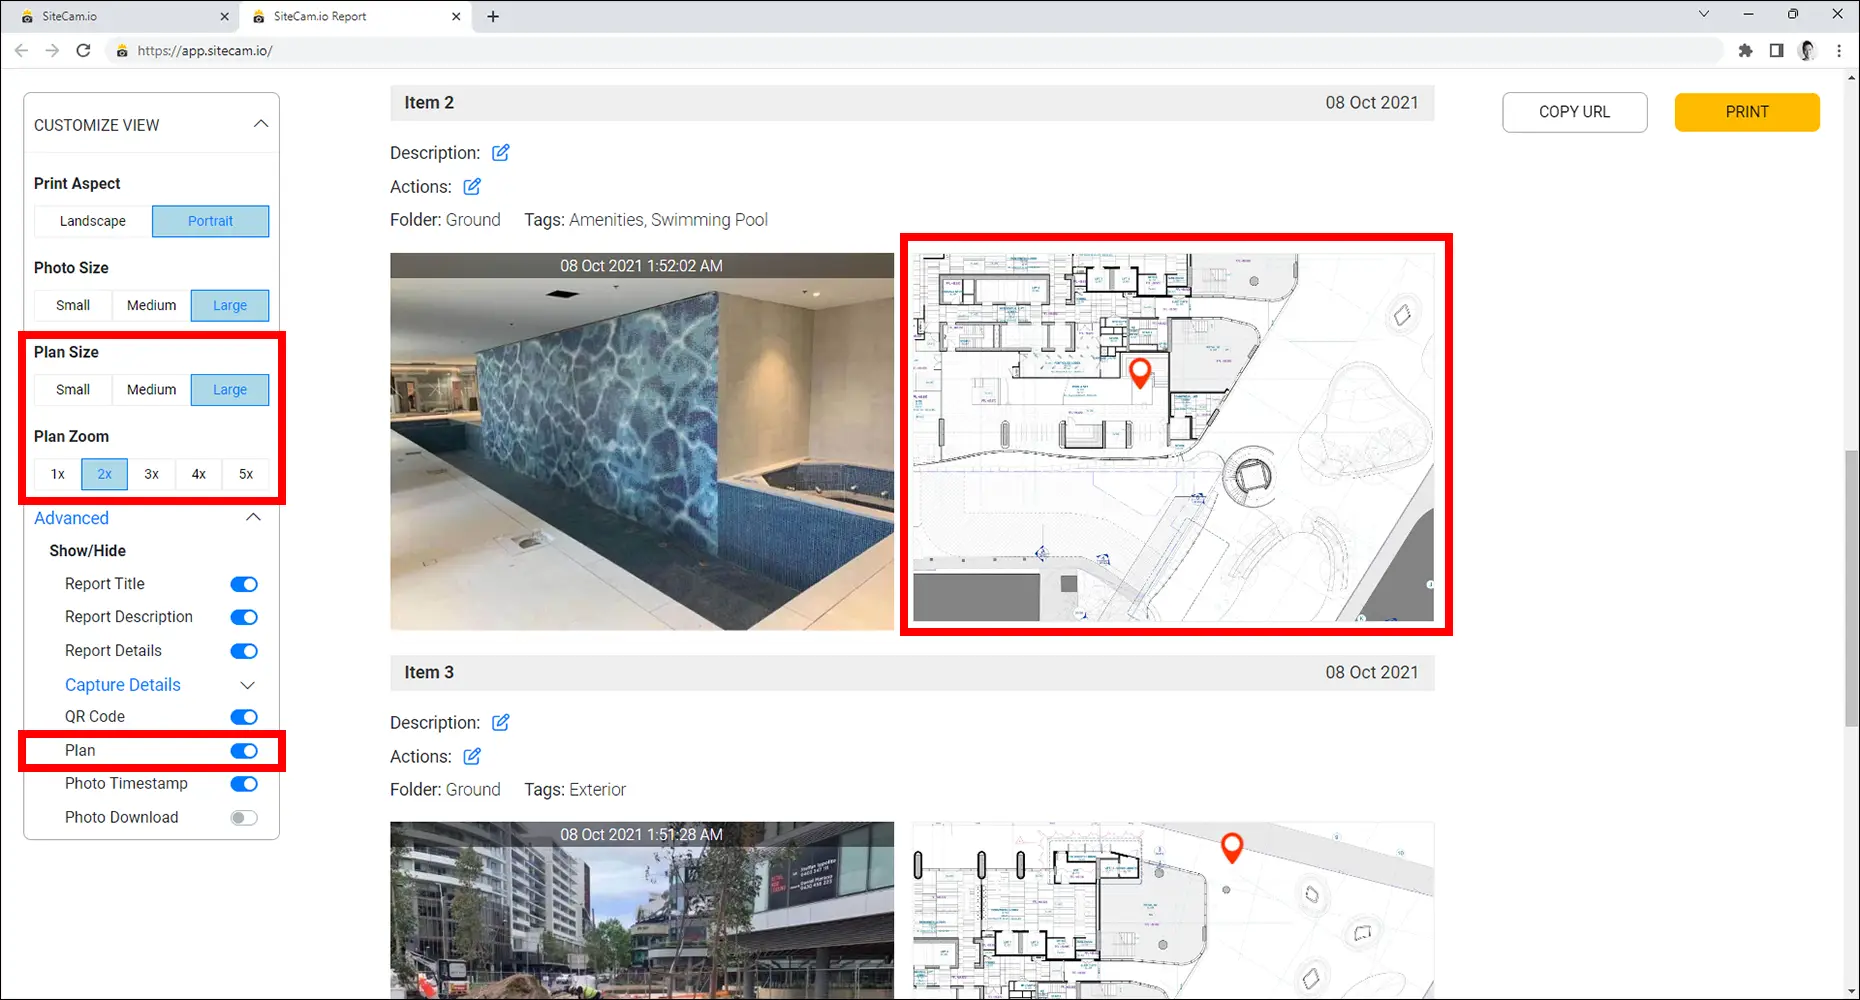
The Plan Settings allow you to customize the following plan components of your report:
- Show Plan – Choose whether to show or hide plan.
- Size – There are three different plan sizes you can choose from (Small, Medium or Large).
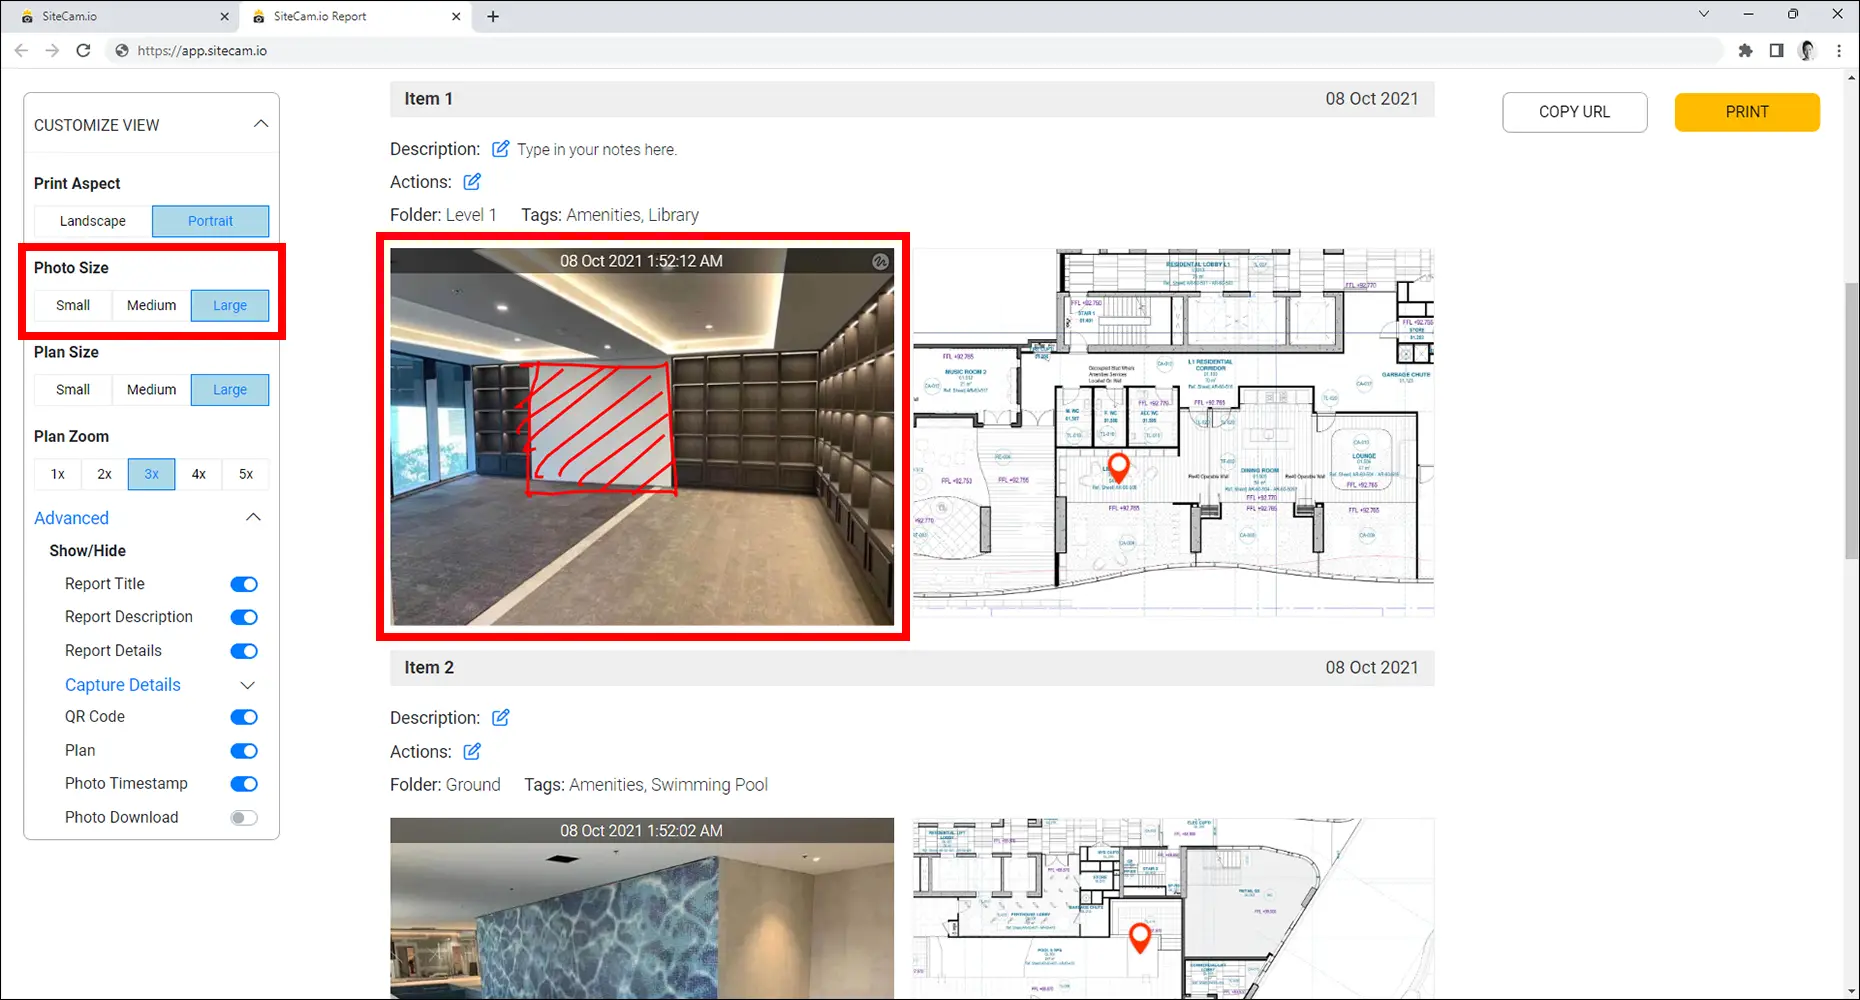
- Zoom – There are five zoom levels to choose from (1 – 5x).

Map Settings
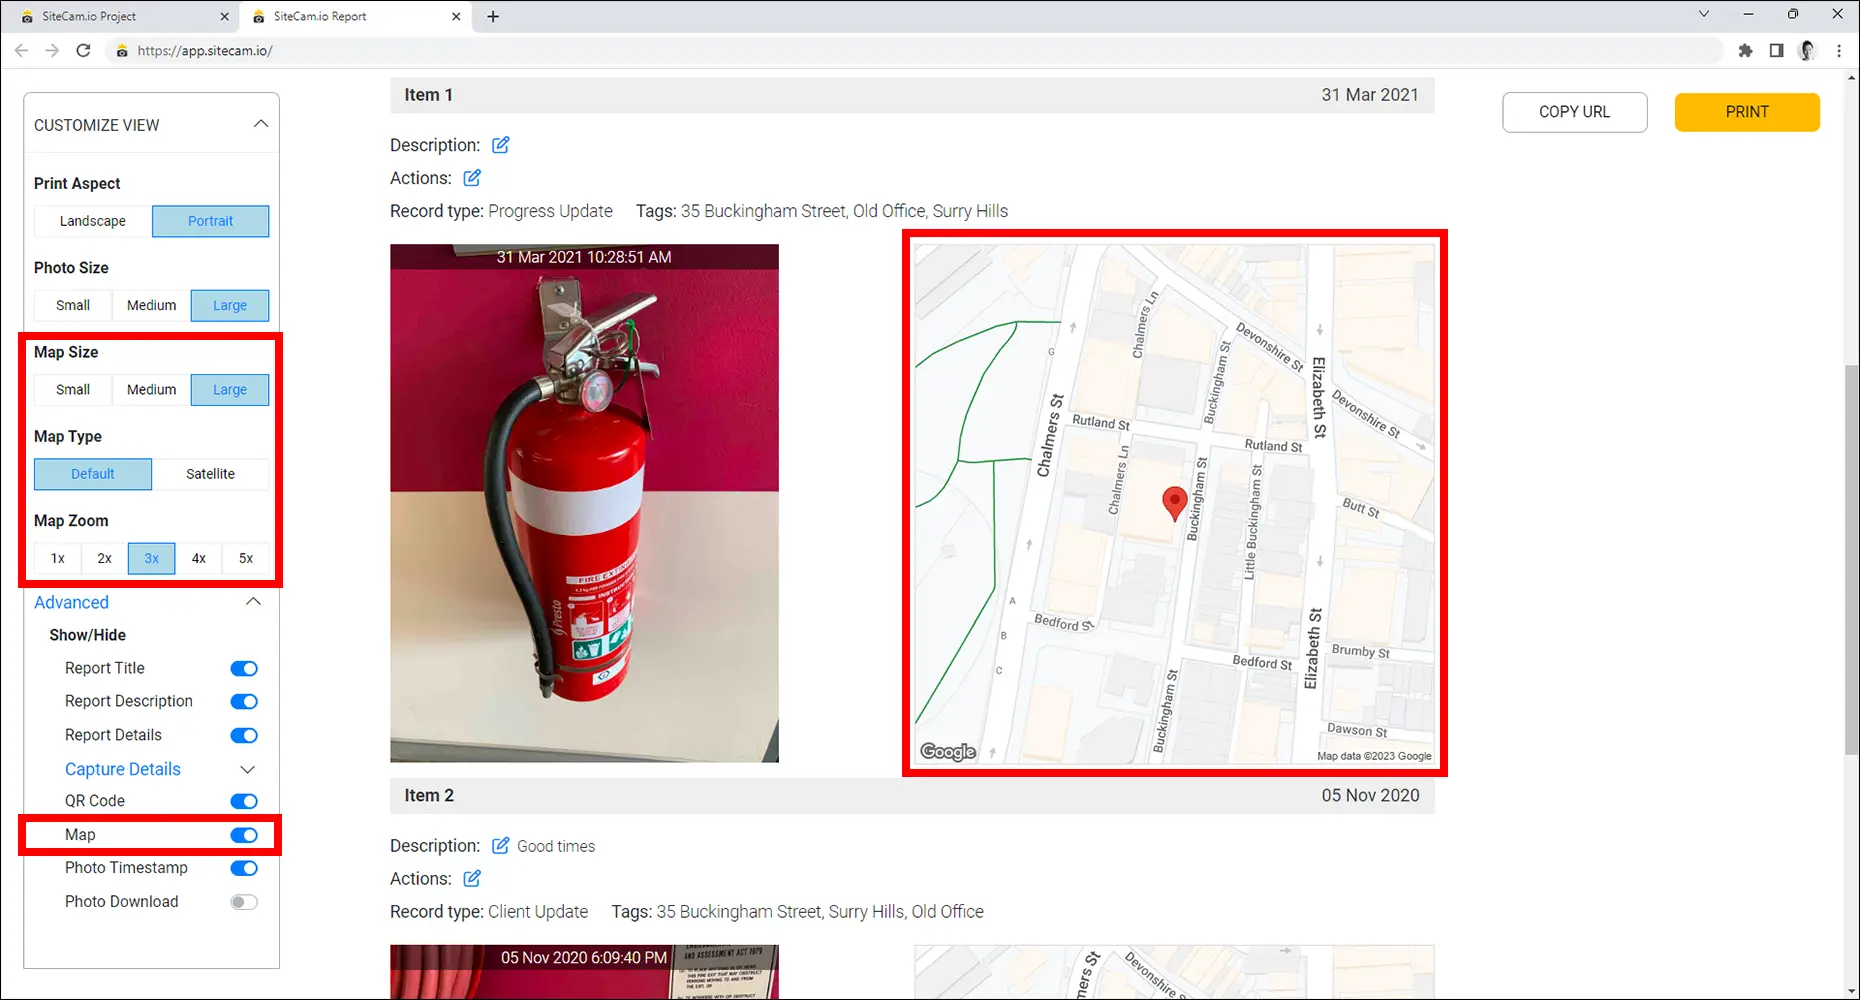
If your report does not contain plans, maps will be displayed by default. The Map Settings allow you to customize the following map components of your report:
- Show Map – Choose whether to show or hide map.
- Size – There are three different map sizes you can choose from (Small, Medium or Large).
- Zoom – There are five zoom levels to choose from (1 – 5x).
- Map Type – Choose between Default and Satellite view.

Item Settings
The Items Settings allow you to customize the following components of your report:
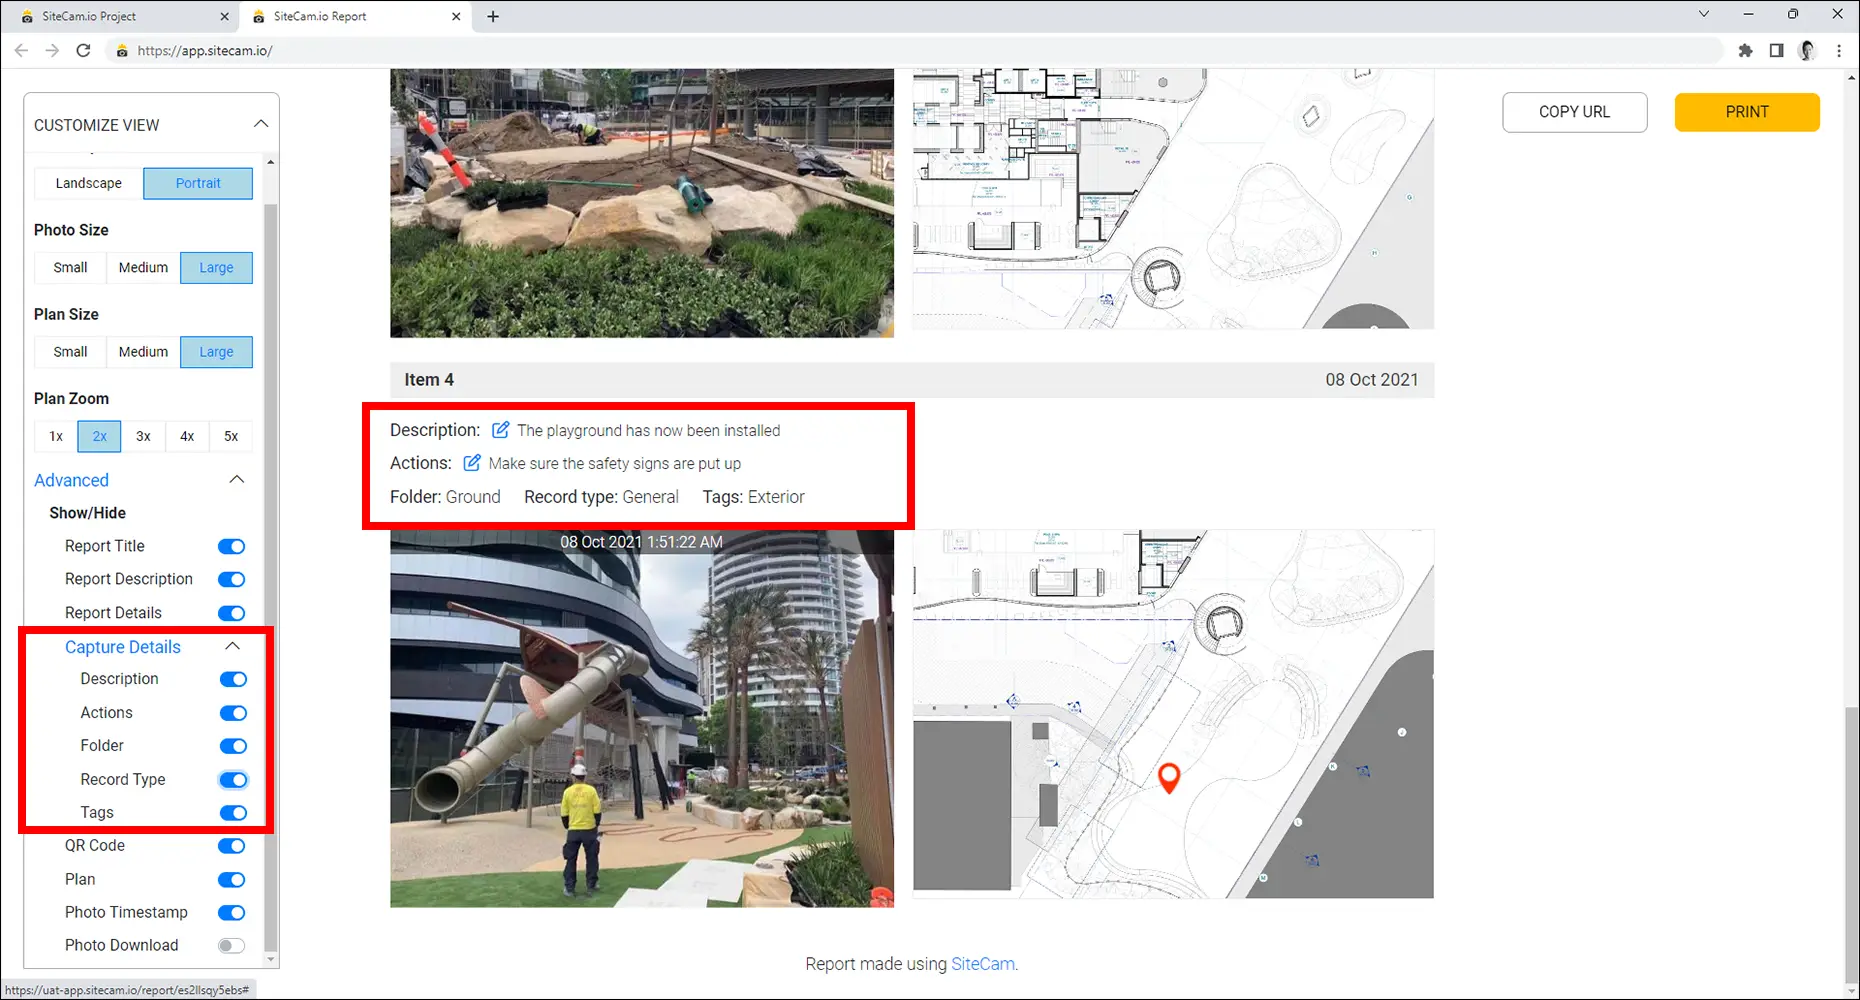
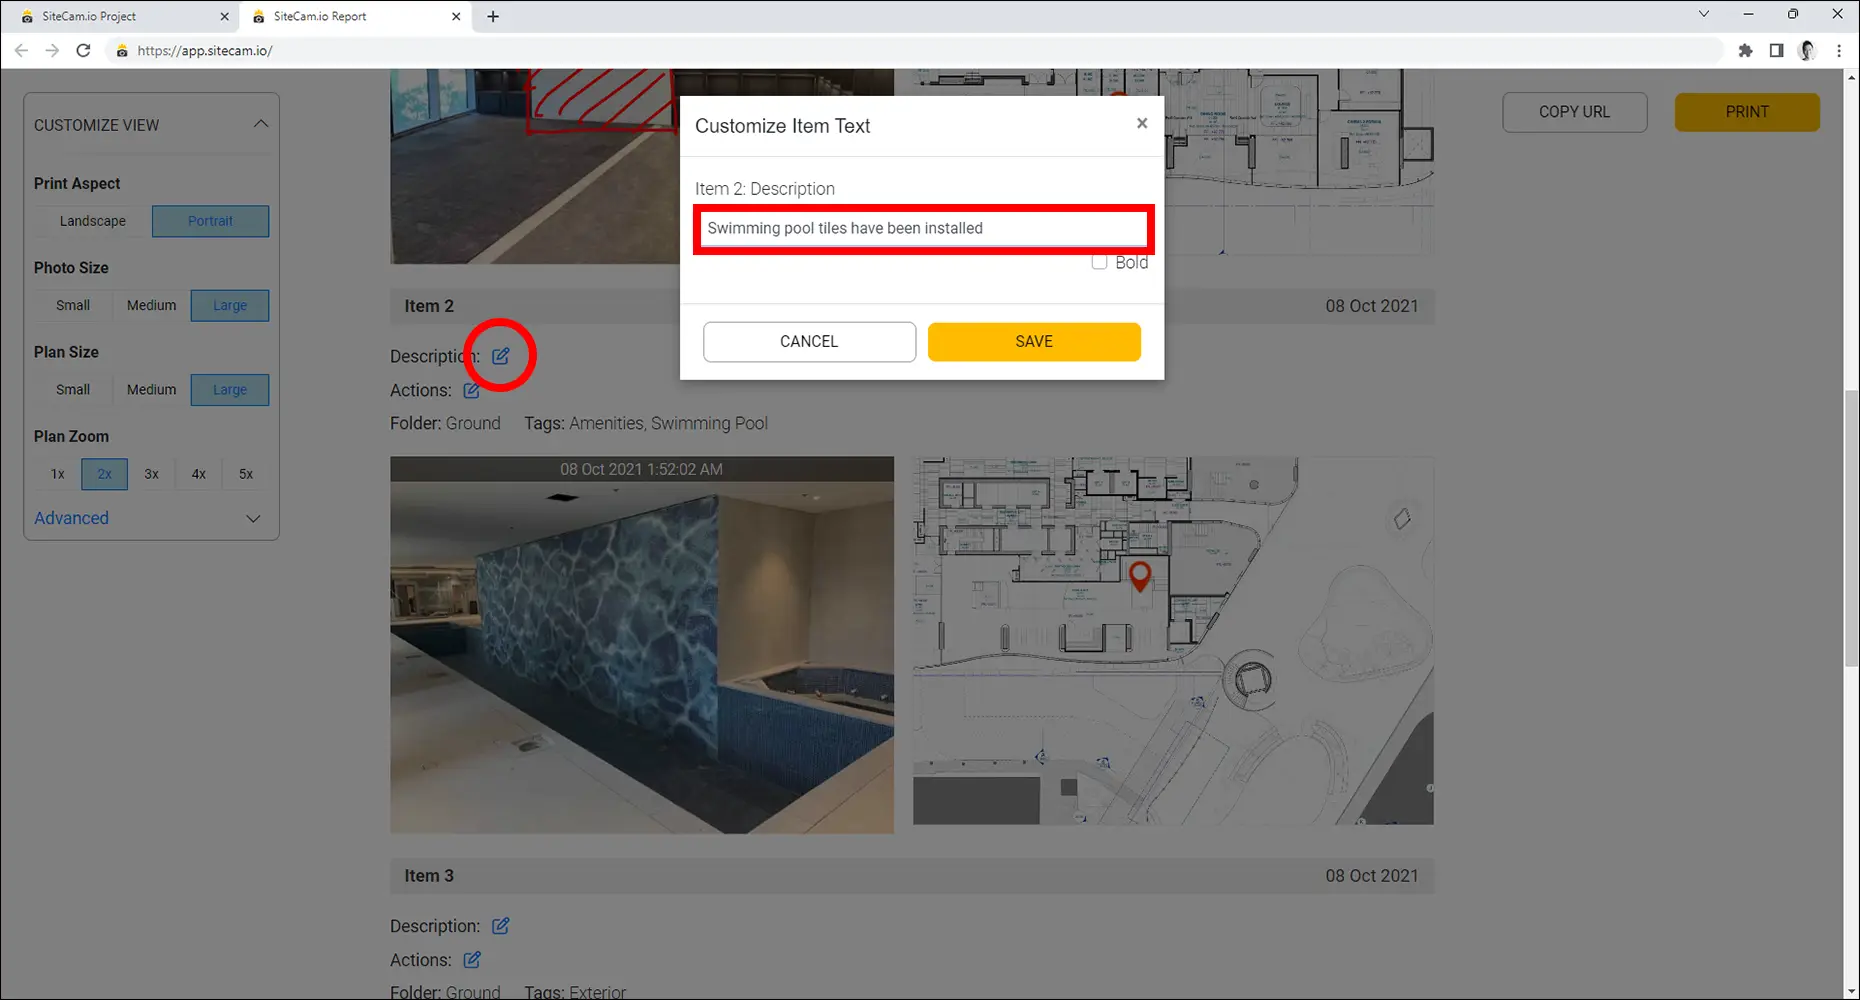
- Description – Show/hide the Description field. Descriptions can be edited by clicking the pencil icon.
- Folder – Show/hide the Folder field.
- Record Type – Show/hide the Record Type field.
- Tags – Show/hide the Tags field.
- Sort – Choose how you want to order the items in the report.


Mobile (iOS & Android)
How to Create a Report
1. Open the SiteCam app on your iOS or Android device, then choose a project.
2. If you have lots of photos in your project, it is recommended to first apply some filters to narrow down the photos to include in the report.

In this example we have filtered the project to only show photos captured on the 9th November 2021.

3. Tap on the ‘…’ icon on the top right of the screen, then select Generate Photo Report.

4. Select the photos that you want to include in the report by tapping on the thumbnails. You can quickly Select All or Select None by using the buttons at the bottom. Tap Next to continue.

5. Give your report a name and enter some description.

6. Any descriptions that have previously been added to each group will automatically be included in the report. You can add new descriptions or modify existing ones if you wish.

The Sort feature gives you options on how you want to order the items in your report.

7. Once you’re done, tap Publish to generate the report.

How to Share a Report (URL)
To get a link to the online report simply tap on the ‘…’ icon, then select Copy URL.

How to Download a Report (PDF)
1. To download the report as a PDF tap on the ‘…’ icon, then select Safe/Print PDF.

2. On iOS devices, PDF report saving is done via the device’s print interface. Tap OK to proceed.
On Android devices, this step is skipped.

3. On iOS devices, tap on the Share icon.
On Android devices, simply tap on the PDF button.

4. Navigate to the folder you would like to save the file to on your device.

Customizing the report
You can customize the look of your report by tapping on the Customize View button.

Within the Customize View options panel, you will have the ability to configure the following components of the report:
1. Report Title – Show/hide and edit the report title.
2. Report Description – Show/hide and edit the report description.
3. Report Details – Show/hide additional information about the report, i.e. Date, captured by, number of items/photos & QR code.
4. Image Size – Adjust the size of the photo thumbnails (Small, Medium or Large).
5. QR Code – Show/hide a QR Code, this allows the online report to be easily accessible through scanning the QR Code.

6. Plan/Map Settings – These settings allow you to show/hide any plan or map, their size, zoom level, as well as the map type.

7. Description – Show/hide the item Description field.
8. Photo Timestamps – Show/hide photo date & time.
9. Photo GPS – Show/hide photo GPS coordinate.
10. Location – Show/hide the Folder field.
11. Record Type – Show/hide the Record Type field.
12. Tags – Show/hide the Tags field.